Center for Interventional Biomaterials, School of Biological and Health Systems Engineering, Arizona State University, P.O. Box 879709, Tempe, AZ 85287, USA.
Comput Math Methods Med. 2013;2013:149608. doi: 10.1155/2013/149608. Epub 2013 Apr 24.
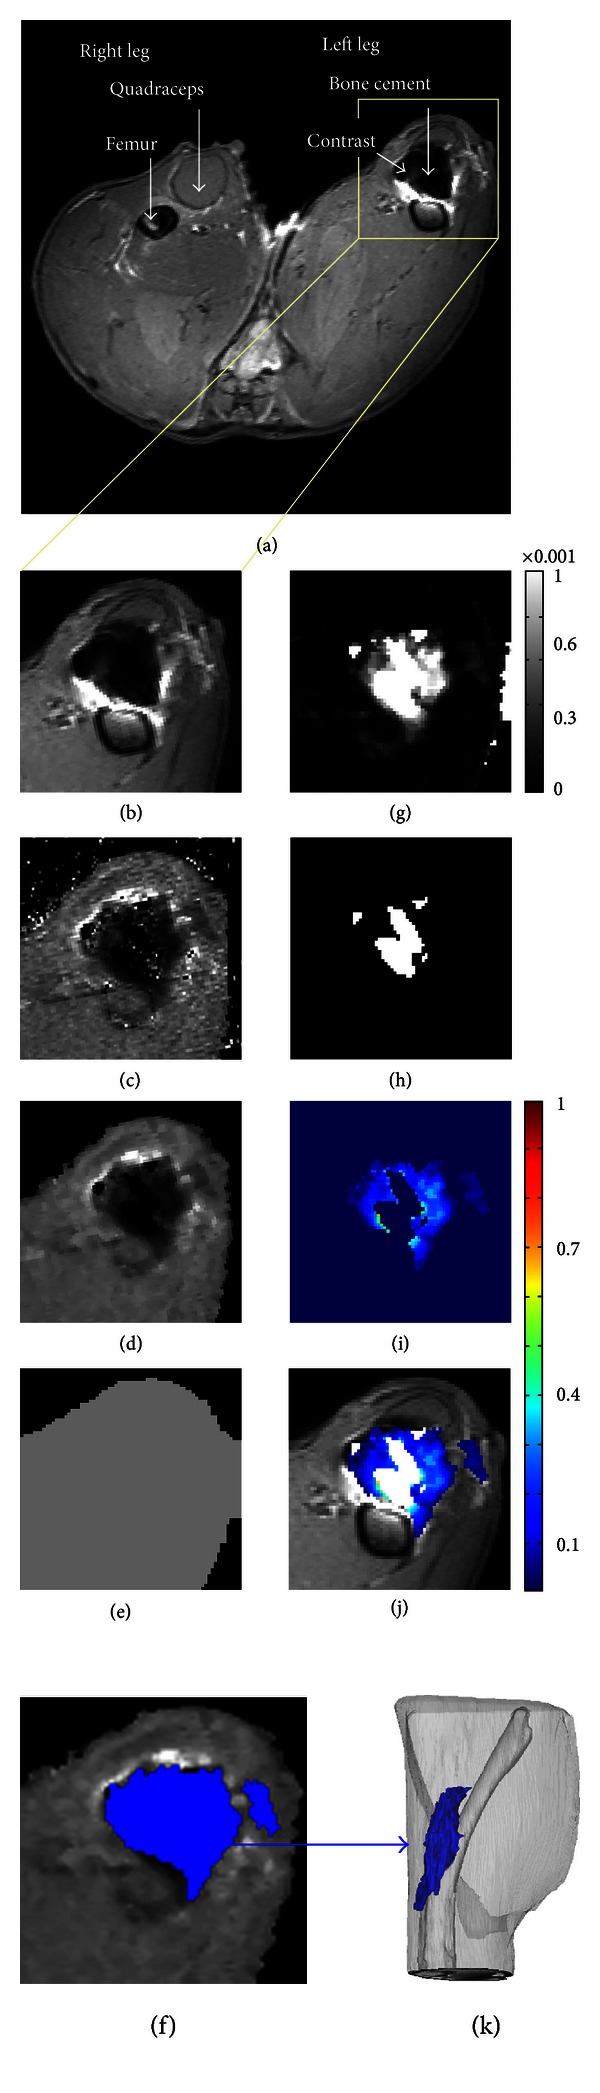
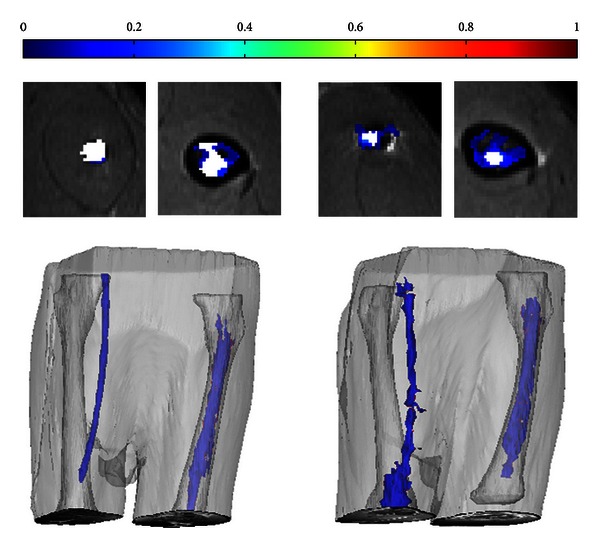
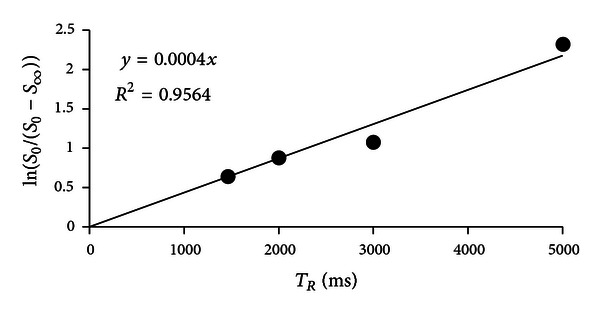
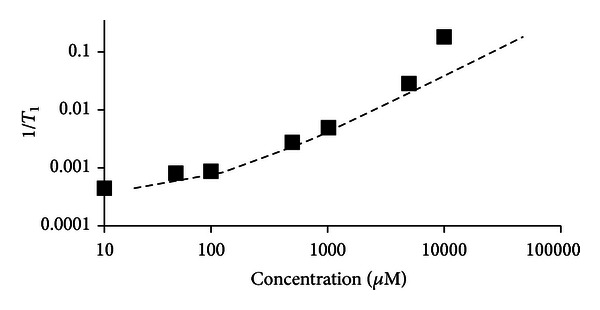
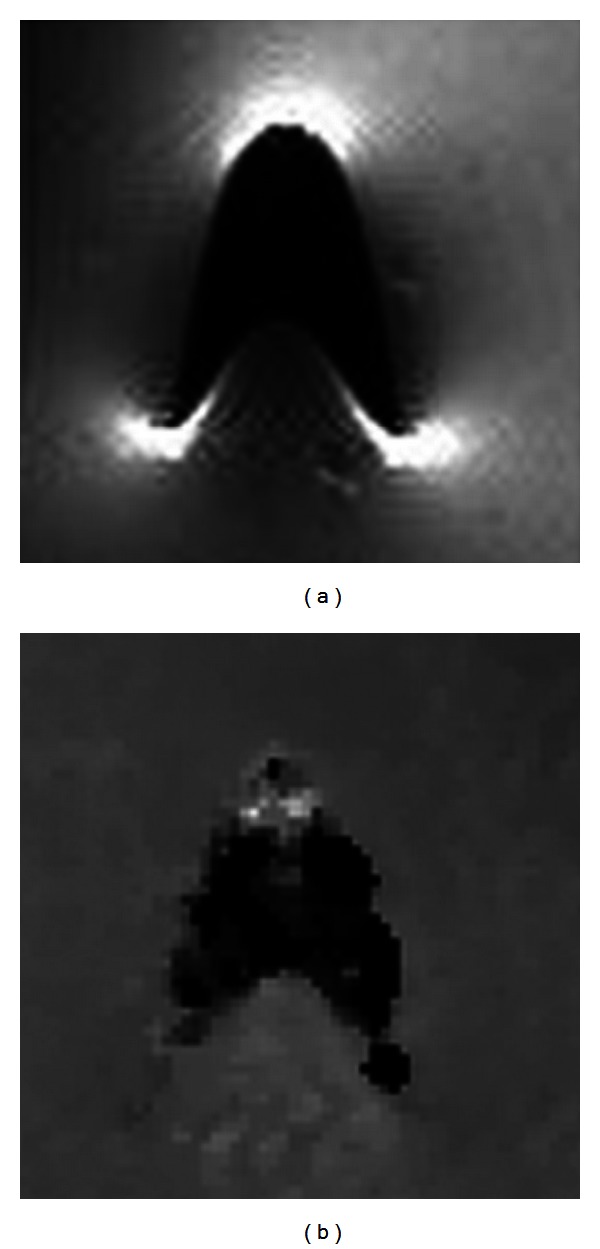
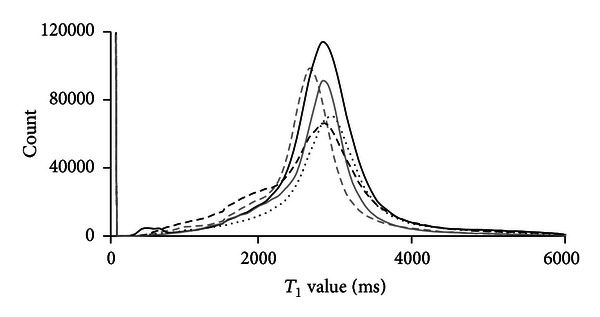
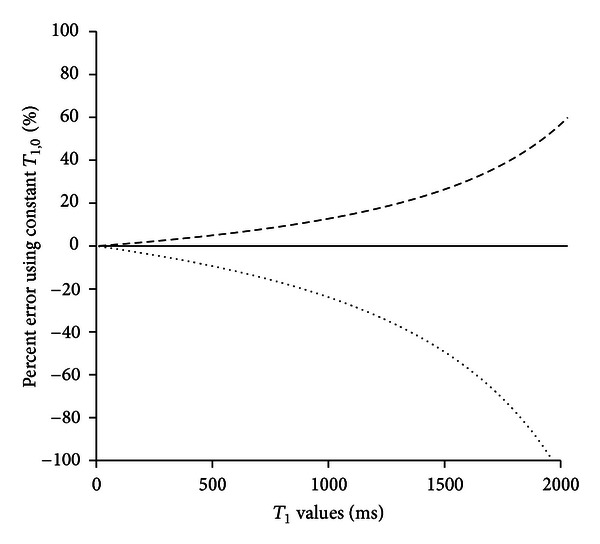
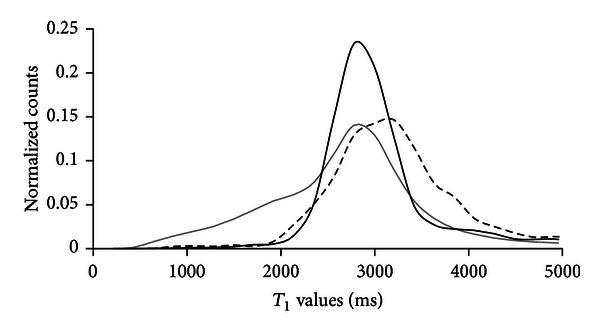
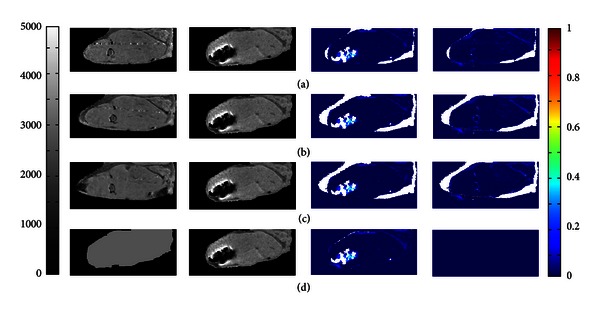
Controlled release formulations for local, in vivo drug delivery are of growing interest to device manufacturers, research scientists, and clinicians; however, most research characterizing controlled release formulations occurs in vitro because the spatial and temporal distribution of drug delivery is difficult to measure in vivo. In this work, in vivo magnetic resonance imaging (MRI) of local drug delivery was performed to visualize and quantify the time resolved distribution of MRI contrast agents. Three-dimensional T1 maps (generated from T1-weighted images with varied TR) were processed using noise-reducing filtering. A segmented region of contrast, from a thresholded image, was converted to concentration maps using the equation 1/T1=1/T1,0+R1C, where T1,0 and T1 are the precontrast and postcontrast T1 map values, respectively. In this technique, a uniform estimated value for T 1,0 was used. Error estimations were performed for each step. The practical usefulness of this method was assessed using comparisons between devices located in different locations both with and without contrast. The method using a uniform T1,0, requiring no registration of pre- and postcontrast image volumes, was compared to a method using either affine or deformation registrations.
用于局部、体内药物输送的控释制剂越来越受到器械制造商、研究科学家和临床医生的关注;然而,由于体内药物输送的空间和时间分布难以测量,大多数描述控释制剂的研究都是在体外进行的。在这项工作中,进行了体内磁共振成像 (MRI) 局部药物输送,以可视化和量化 MRI 对比剂的时间分辨分布。使用降噪滤波处理来自具有不同 TR 的 T1 加权图像的三维 T1 图(从 T1 加权图像生成)。使用方程 1/T1=1/T1,0+R1C 将来自阈值图像的对比分段区域转换为浓度图,其中 T1,0 和 T1 分别是预对比和后对比 T1 图的值。在该技术中,使用均匀的 T1,0 估计值。对每个步骤进行误差估计。使用位于不同位置的器械进行比较,评估了该方法的实际用途,包括有无对比剂。使用均匀 T1,0 的方法(不需要对预对比和后对比图像体积进行配准)与使用仿射或变形配准的方法进行了比较。