• 文献检索
  • 文档翻译
  • 深度研究
  • 学术资讯
  • Suppr Zotero 插件Zotero 插件
  • 邀请有礼
  • 套餐&价格
  • 历史记录
应用&插件
Suppr Zotero 插件Zotero 插件浏览器插件Mac 客户端Windows 客户端微信小程序
定价
高级版会员购买积分包购买API积分包
服务
文献检索文档翻译深度研究API 文档MCP 服务
关于我们
关于 Suppr公司介绍联系我们用户协议隐私条款
关注我们

Suppr 超能文献

核心技术专利:CN118964589B侵权必究
粤ICP备2023148730 号-1Suppr @ 2026

文献检索

告别复杂PubMed语法,用中文像聊天一样搜索,搜遍4000万医学文献。AI智能推荐,让科研检索更轻松。

立即免费搜索

文件翻译

保留排版,准确专业,支持PDF/Word/PPT等文件格式,支持 12+语言互译。

免费翻译文档

深度研究

AI帮你快速写综述,25分钟生成高质量综述,智能提取关键信息,辅助科研写作。

立即免费体验

网络查看器:通过分子相互作用规则的嵌入式渲染来可视化生化反应网络。

NetworkViewer: visualizing biochemical reaction networks with embedded rendering of molecular interaction rules.

作者信息

Cheng Hsueh-Chien, Angermann Bastian R, Zhang Fengkai, Meier-Schellersheim Martin

机构信息

Laboratory of Systems Biology, National Institute of Allergy and Infectious Diseases, National Institutes of Health, Building 4, 4 Memorial Drive, 20892 Bethesda, USA.

出版信息

BMC Syst Biol. 2014 Jun 16;8:70. doi: 10.1186/1752-0509-8-70.

DOI:10.1186/1752-0509-8-70
PMID:24934175
原文链接:https://pmc.ncbi.nlm.nih.gov/articles/PMC4094451/
Abstract

BACKGROUND

Network representations of cell-biological signaling processes frequently contain large numbers of interacting molecular and multi-molecular components that can exist in, and switch between, multiple biochemical and/or structural states. In addition, the interaction categories (associations, dissociations and transformations) in such networks cannot satisfactorily be mapped onto simple arrows connecting pairs of components since their specifications involve information such as reaction rates and conditions with regard to the states of the interacting components. This leads to the challenge of having to reconcile competing objectives: providing a high-level overview without omitting relevant information, and showing interaction specifics while not overwhelming users with too much detail displayed simultaneously. This problem is typically addressed by splitting the information required to understand a reaction network model into several categories that are rendered separately through combinations of visualizations and/or textual and tabular elements, requiring modelers to consult several sources to obtain comprehensive insights into the underlying assumptions of the model.

RESULTS

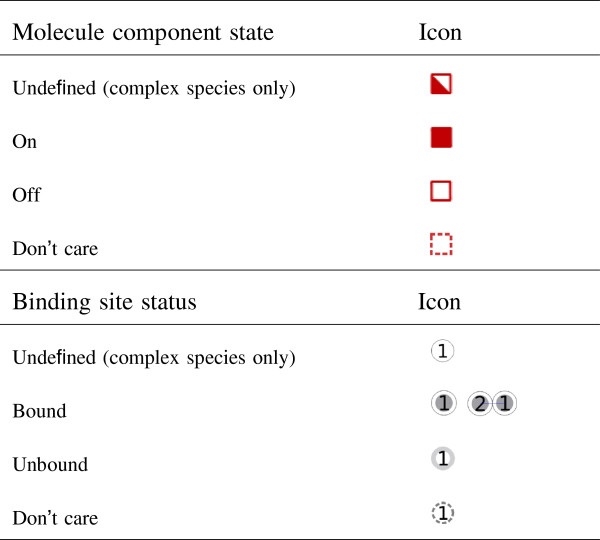
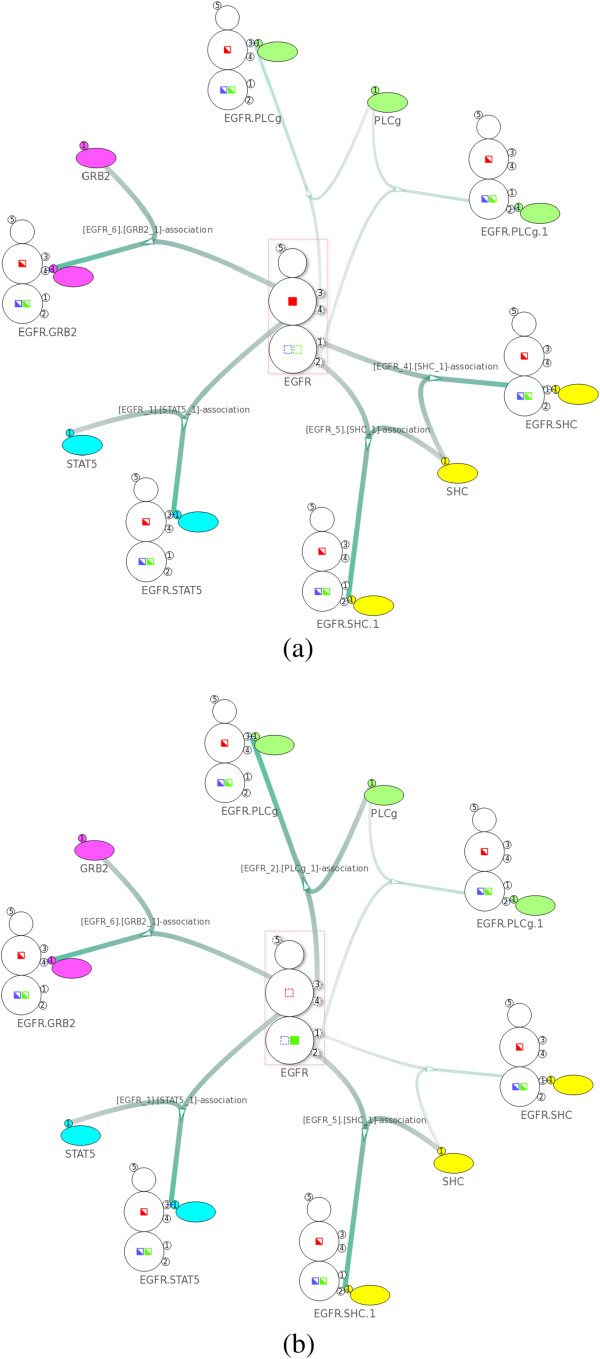
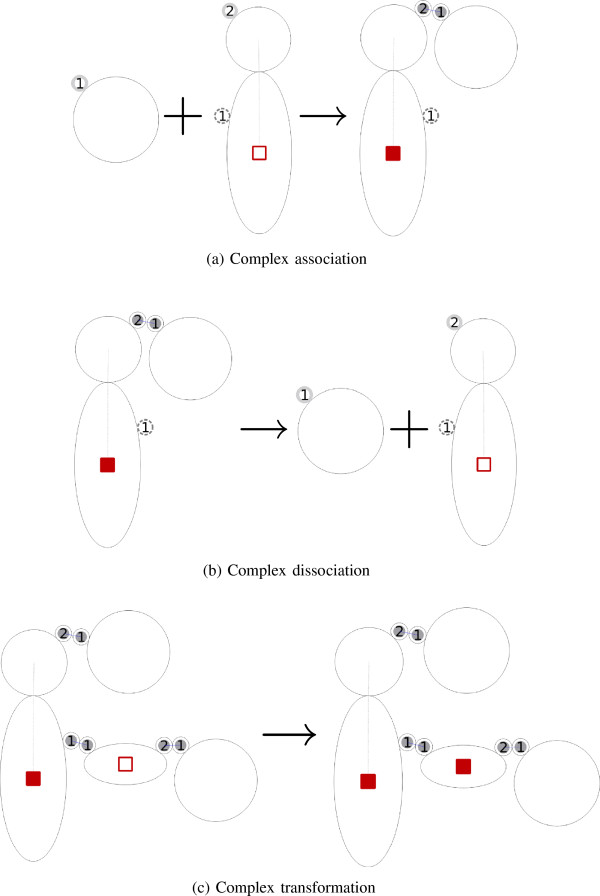
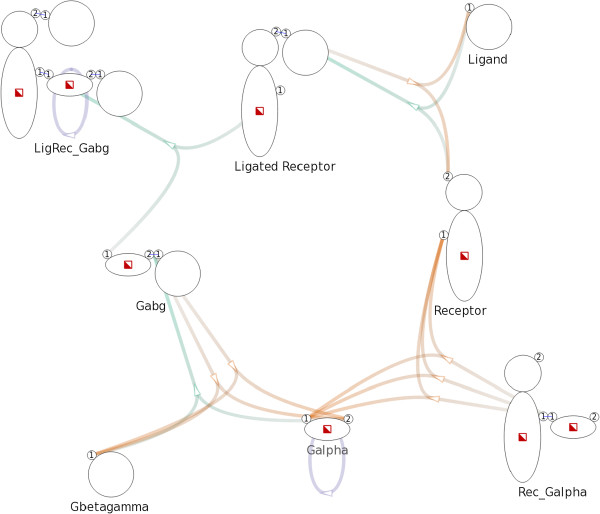
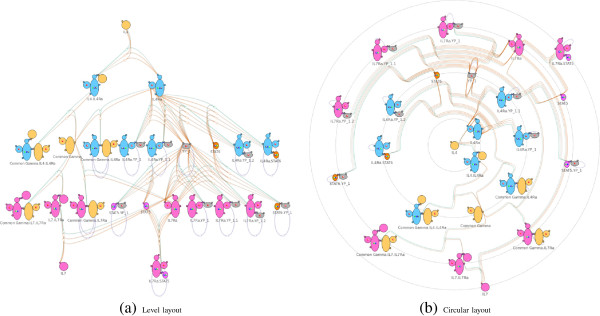
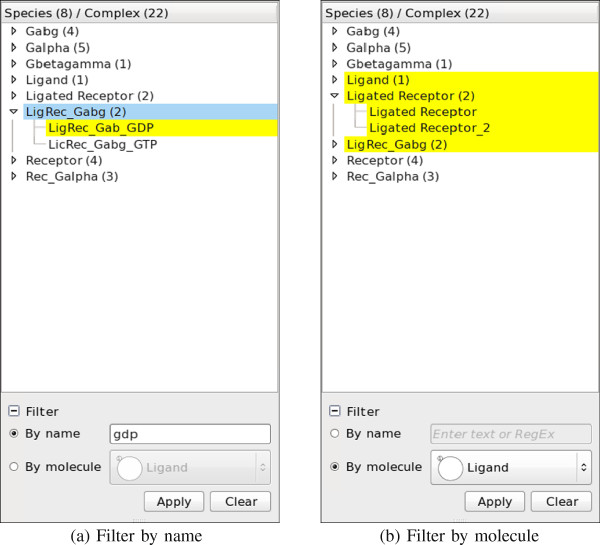
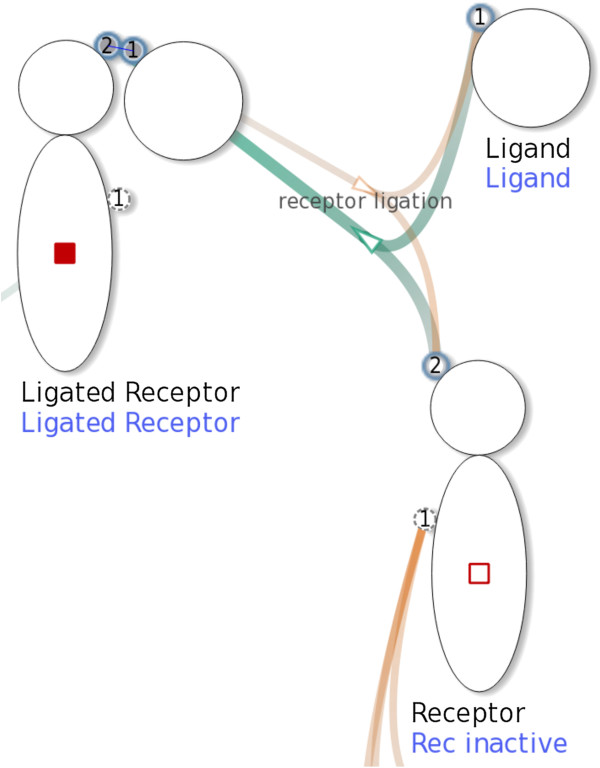
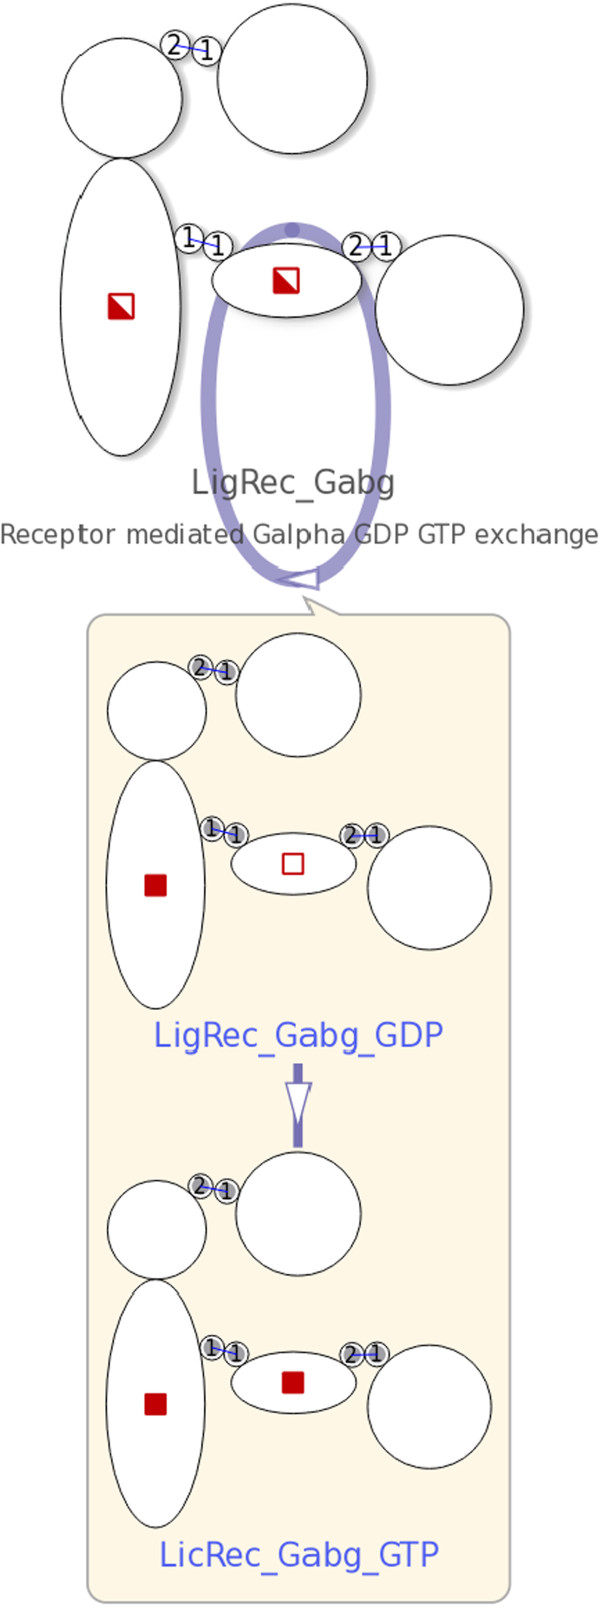
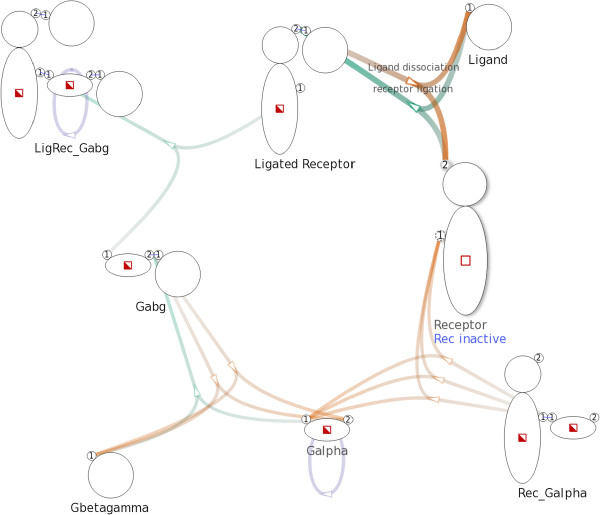
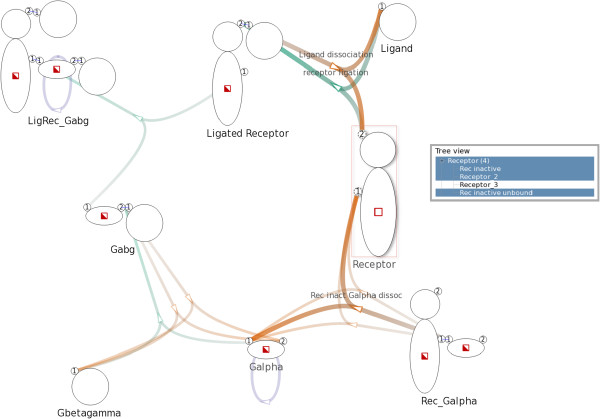
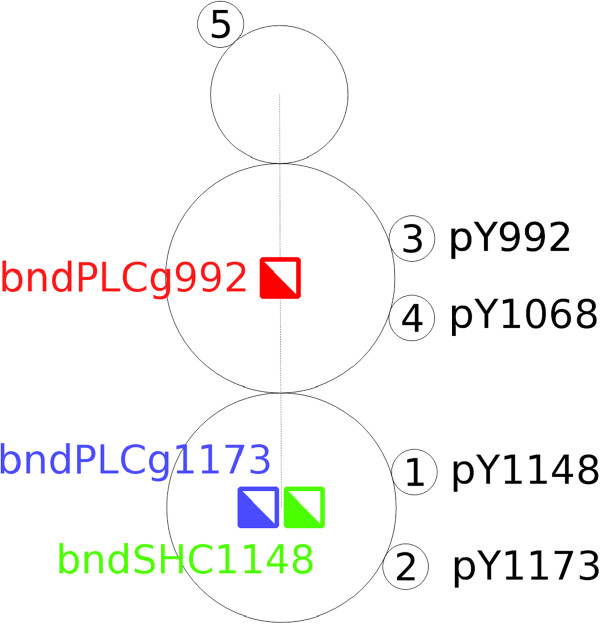
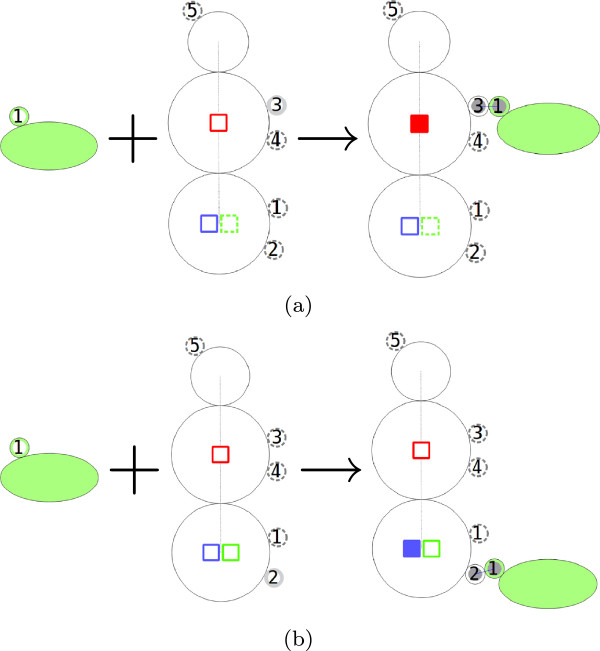
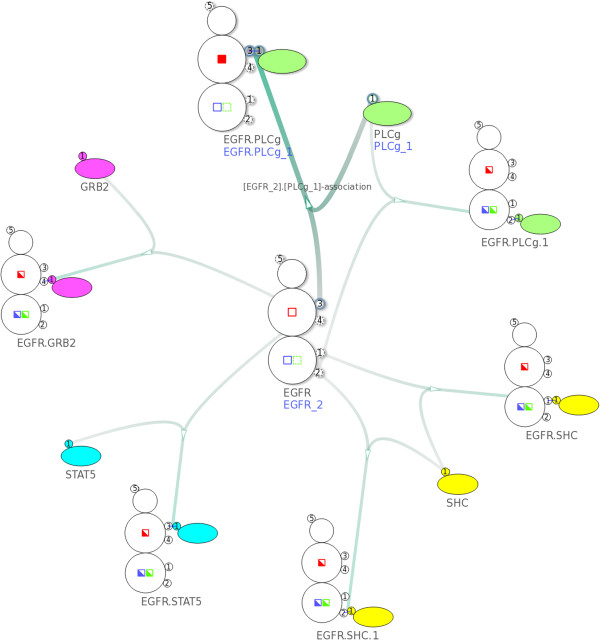
We report the development of an application, the Simmune NetworkViewer, that visualizes biochemical reaction networks using iconographic representations of protein interactions and the conditions under which the interactions take place using the same symbols that were used to specify the underlying model with the Simmune Modeler. This approach not only provides a coherent model representation but, moreover, following the principle of "overview first, zoom and filter, then details-on-demand," can generate an overview visualization of the global network and, upon user request, presents more detailed views of local sub-networks and the underlying reaction rules for selected interactions. This visual integration of information would be difficult to achieve with static network representations or approaches that use scripted model specifications without offering simple but detailed symbolic representations of molecular interactions, their conditions and consequences in terms of biochemical modifications.

CONCLUSIONS

The Simmune NetworkViewer provides concise, yet comprehensive visualizations of reaction networks created in the Simmune framework. In the near future, by adopting the upcoming SBML standard for encoding multi-component, multi-state molecular complexes and their interactions as input, the NetworkViewer will, moreover, be able to offer such visualization for any rule-based model that can be exported to that standard.

摘要

背景

细胞生物学信号传导过程的网络表示通常包含大量相互作用的分子和多分子成分,这些成分可以存在于多种生化和/或结构状态中,并在这些状态之间切换。此外,此类网络中的相互作用类别(关联、解离和转化)无法令人满意地映射到连接成对成分的简单箭头上,因为它们的规范涉及诸如反应速率和关于相互作用成分状态的条件等信息。这就带来了必须协调相互竞争目标的挑战:提供高层次的概述而不遗漏相关信息,同时展示相互作用的细节而又不会因同时显示过多细节而使用户应接不暇。这个问题通常通过将理解反应网络模型所需的信息分为几类来解决,这些信息通过可视化和/或文本及表格元素的组合分别呈现,这要求建模者查阅多个来源才能全面了解模型的基本假设。

结果

我们报告了一个应用程序Simmune NetworkViewer的开发,它使用蛋白质相互作用的图标表示以及使用与Simmune Modeler用于指定基础模型相同的符号来表示相互作用发生的条件,从而可视化生化反应网络。这种方法不仅提供了连贯的模型表示,而且遵循“先概述,再缩放和过滤,然后按需查看细节”的原则,可以生成全局网络的概述可视化,并根据用户请求呈现局部子网的更详细视图以及所选相互作用的基础反应规则。对于静态网络表示或使用脚本化模型规范而不提供分子相互作用、其条件以及生化修饰方面的简单但详细的符号表示的方法,这种信息的可视化集成很难实现。

结论

Simmune NetworkViewer为在Simmune框架中创建的反应网络提供了简洁而全面的可视化。在不久的将来,通过采用即将推出的用于编码多组分、多状态分子复合物及其相互作用作为输入的SBML标准,NetworkViewer还将能够为任何可以导出到该标准的基于规则的模型提供此类可视化。

https://cdn.ncbi.nlm.nih.gov/pmc/blobs/4f43/4094451/3db16bd37696/1752-0509-8-70-13.jpg
https://cdn.ncbi.nlm.nih.gov/pmc/blobs/4f43/4094451/418f40327f0a/1752-0509-8-70-1.jpg
https://cdn.ncbi.nlm.nih.gov/pmc/blobs/4f43/4094451/3e3ae78d7366/1752-0509-8-70-2.jpg
https://cdn.ncbi.nlm.nih.gov/pmc/blobs/4f43/4094451/6c013a1256da/1752-0509-8-70-3.jpg
https://cdn.ncbi.nlm.nih.gov/pmc/blobs/4f43/4094451/bd47ff7a6773/1752-0509-8-70-4.jpg
https://cdn.ncbi.nlm.nih.gov/pmc/blobs/4f43/4094451/c8d2fe9f78d7/1752-0509-8-70-5.jpg
https://cdn.ncbi.nlm.nih.gov/pmc/blobs/4f43/4094451/4041fddf979e/1752-0509-8-70-6.jpg
https://cdn.ncbi.nlm.nih.gov/pmc/blobs/4f43/4094451/08d5bd68edb1/1752-0509-8-70-7.jpg
https://cdn.ncbi.nlm.nih.gov/pmc/blobs/4f43/4094451/01329c6212d3/1752-0509-8-70-8.jpg
https://cdn.ncbi.nlm.nih.gov/pmc/blobs/4f43/4094451/989f1fee1ef5/1752-0509-8-70-9.jpg
https://cdn.ncbi.nlm.nih.gov/pmc/blobs/4f43/4094451/4b80d9ea8bea/1752-0509-8-70-10.jpg
https://cdn.ncbi.nlm.nih.gov/pmc/blobs/4f43/4094451/c31a3678837c/1752-0509-8-70-11.jpg
https://cdn.ncbi.nlm.nih.gov/pmc/blobs/4f43/4094451/b402ad289a27/1752-0509-8-70-12.jpg
https://cdn.ncbi.nlm.nih.gov/pmc/blobs/4f43/4094451/3db16bd37696/1752-0509-8-70-13.jpg

相似文献

1
NetworkViewer: visualizing biochemical reaction networks with embedded rendering of molecular interaction rules.网络查看器:通过分子相互作用规则的嵌入式渲染来可视化生化反应网络。
BMC Syst Biol. 2014 Jun 16;8:70. doi: 10.1186/1752-0509-8-70.
2
The Simmune Modeler visual interface for creating signaling networks based on bi-molecular interactions.基于双分子相互作用创建信号网络的 Simmune Modeler 可视化界面。
Bioinformatics. 2013 May 1;29(9):1229-30. doi: 10.1093/bioinformatics/btt134. Epub 2013 Mar 17.
3
SBML Level 3 package: Multistate, Multicomponent and Multicompartment Species, Version 1, Release 1.SBML 第3级包:多状态、多组分和多隔室物种,版本1,发行版1。
J Integr Bioinform. 2018 Apr 20;15(1):20170077. doi: 10.1515/jib-2017-0077.
4
Systems biology markup language (SBML) level 3 package: multistate, multicomponent and multicompartment species, version 1, release 2.系统生物学标记语言 (SBML) 级别 3 包:多态、多组分和多腔物种,版本 1,发布 2。
J Integr Bioinform. 2020 Jul 6;17(2-3):20200015. doi: 10.1515/jib-2020-0015.
5
Automated visualization of rule-based models.基于规则模型的自动化可视化
PLoS Comput Biol. 2017 Nov 13;13(11):e1005857. doi: 10.1371/journal.pcbi.1005857. eCollection 2017 Nov.
6
ProteoLens: a visual analytic tool for multi-scale database-driven biological network data mining.ProteoLens:一种用于多尺度数据库驱动的生物网络数据挖掘的可视化分析工具。
BMC Bioinformatics. 2008 Aug 12;9 Suppl 9(Suppl 9):S5. doi: 10.1186/1471-2105-9-S9-S5.
7
JNets: exploring networks by integrating annotation.JNets:通过整合注释来探索网络。
BMC Bioinformatics. 2009 Mar 26;10:95. doi: 10.1186/1471-2105-10-95.
8
Macromolecular crowding: chemistry and physics meet biology (Ascona, Switzerland, 10-14 June 2012).大分子拥挤现象:化学与物理邂逅生物学(瑞士阿斯科纳,2012年6月10日至14日)
Phys Biol. 2013 Aug;10(4):040301. doi: 10.1088/1478-3975/10/4/040301. Epub 2013 Aug 2.
9
NetworkAnalyst--integrative approaches for protein-protein interaction network analysis and visual exploration.网络分析员--蛋白质-蛋白质相互作用网络分析和可视化探索的综合方法。
Nucleic Acids Res. 2014 Jul;42(Web Server issue):W167-74. doi: 10.1093/nar/gku443. Epub 2014 May 26.
10
Simulation of large-scale rule-based models.大规模基于规则模型的模拟
Bioinformatics. 2009 Apr 1;25(7):910-7. doi: 10.1093/bioinformatics/btp066. Epub 2009 Feb 11.

引用本文的文献

1
Heron: Visualizing and Controlling Chemical Reaction Explorations and Networks.赫伦:可视化与控制化学反应探索及网络
J Phys Chem A. 2024 Oct 17;128(41):9028-9044. doi: 10.1021/acs.jpca.4c03936. Epub 2024 Oct 3.
2
bnglViz: online visualization of rule-based models.bnglViz:基于规则的模型的在线可视化。
Bioinformatics. 2024 Jun 3;40(6). doi: 10.1093/bioinformatics/btae351.
3
Interactive Multiresolution Visualization of Cellular Network Processes.细胞网络过程的交互式多分辨率可视化

本文引用的文献

1
The Simmune Modeler visual interface for creating signaling networks based on bi-molecular interactions.基于双分子相互作用创建信号网络的 Simmune Modeler 可视化界面。
Bioinformatics. 2013 May 1;29(9):1229-30. doi: 10.1093/bioinformatics/btt134. Epub 2013 Mar 17.
2
RuleBender: integrated modeling, simulation and visualization for rule-based intracellular biochemistry.RuleBender:基于规则的细胞内生物化学的集成建模、模拟和可视化。
BMC Bioinformatics. 2012;13 Suppl 8(Suppl 8):S3. doi: 10.1186/1471-2105-13-S8-S3. Epub 2012 May 18.
3
Software support for SBGN maps: SBGN-ML and LibSBGN.
iScience. 2020 Jan 24;23(1):100748. doi: 10.1016/j.isci.2019.100748. Epub 2019 Nov 29.
4
Anosmin1 Shuttles Fgf to Facilitate Its Diffusion, Increase Its Local Concentration, and Induce Sensory Organs.anosmin1 将 Fgf 穿梭运输以促进其扩散、增加其局部浓度并诱导感觉器官。
Dev Cell. 2018 Sep 24;46(6):751-766.e12. doi: 10.1016/j.devcel.2018.07.015. Epub 2018 Aug 16.
5
Automated visualization of rule-based models.基于规则模型的自动化可视化
PLoS Comput Biol. 2017 Nov 13;13(11):e1005857. doi: 10.1371/journal.pcbi.1005857. eCollection 2017 Nov.
6
Modeling for (physical) biologists: an introduction to the rule-based approach.面向(生物物理学)生物学家的建模:基于规则方法简介。
Phys Biol. 2015 Jul 16;12(4):045007. doi: 10.1088/1478-3975/12/4/045007.
7
MOSBIE: a tool for comparison and analysis of rule-based biochemical models.MOSBIE:一种用于基于规则的生化模型比较与分析的工具。
BMC Bioinformatics. 2014 Sep 25;15(1):316. doi: 10.1186/1471-2105-15-316.
软件支持 SBGN 图:SBGN-ML 和 LibSBGN。
Bioinformatics. 2012 Aug 1;28(15):2016-21. doi: 10.1093/bioinformatics/bts270. Epub 2012 May 10.
4
A framework for mapping, visualisation and automatic model creation of signal-transduction networks.信号转导网络的映射、可视化和自动建模框架。
Mol Syst Biol. 2012 Apr 24;8:578. doi: 10.1038/msb.2012.12.
5
Computational modeling of cellular signaling processes embedded into dynamic spatial contexts.嵌入动态空间上下文的细胞信号转导过程的计算建模。
Nat Methods. 2012 Jan 29;9(3):283-9. doi: 10.1038/nmeth.1861.
6
Guidelines for visualizing and annotating rule-based models.基于规则的模型的可视化与标注指南。
Mol Biosyst. 2011 Oct;7(10):2779-95. doi: 10.1039/c1mb05077j. Epub 2011 Jun 7.
7
A formal MIM specification and tools for the common exchange of MIM diagrams: an XML-Based format, an API, and a validation method.一种用于 MIM 图通用交换的正式 MIM 规范和工具:基于 XML 的格式、API 和验证方法。
BMC Bioinformatics. 2011 May 17;12:167. doi: 10.1186/1471-2105-12-167.
8
Spatio-temporal modeling of signaling protein recruitment to EGFR.信号蛋白募集至表皮生长因子受体的时空建模
BMC Syst Biol. 2010 May 6;4:57. doi: 10.1186/1752-0509-4-57.
9
Multiscale modeling for biologists.生物学家的多尺度建模。
Wiley Interdiscip Rev Syst Biol Med. 2009 Jul-Aug;1(1):4-14. doi: 10.1002/wsbm.33.
10
The Systems Biology Graphical Notation.系统生物学图形表示法。
Nat Biotechnol. 2009 Aug;27(8):735-41. doi: 10.1038/nbt.1558. Epub 2009 Aug 7.