• 文献检索
  • 文档翻译
  • 深度研究
  • 学术资讯
  • Suppr Zotero 插件Zotero 插件
  • 邀请有礼
  • 套餐&价格
  • 历史记录
应用&插件
Suppr Zotero 插件Zotero 插件浏览器插件Mac 客户端Windows 客户端微信小程序
定价
高级版会员购买积分包购买API积分包
服务
文献检索文档翻译深度研究API 文档MCP 服务
关于我们
关于 Suppr公司介绍联系我们用户协议隐私条款
关注我们

Suppr 超能文献

核心技术专利:CN118964589B侵权必究
粤ICP备2023148730 号-1Suppr @ 2026

文献检索

告别复杂PubMed语法,用中文像聊天一样搜索,搜遍4000万医学文献。AI智能推荐,让科研检索更轻松。

立即免费搜索

文件翻译

保留排版,准确专业,支持PDF/Word/PPT等文件格式,支持 12+语言互译。

免费翻译文档

深度研究

AI帮你快速写综述,25分钟生成高质量综述,智能提取关键信息,辅助科研写作。

立即免费体验

CT 灌注分析方法采集时间延长对缺血性脑卒中患者的影响。

Effect of prolonged acquisition intervals for CT-perfusion analysis methods in patients with ischemic stroke.

机构信息

Department of Radiology and Nuclear Medicine, University Medical Center Utrecht, Utrecht, the Netherlands.

Image Sciences Institute, University Medical Center Utrecht, Utrecht, the Netherlands.

出版信息

Med Phys. 2019 Jul;46(7):3156-3164. doi: 10.1002/mp.13559. Epub 2019 May 27.

DOI:10.1002/mp.13559
PMID:31049968
原文链接:https://pmc.ncbi.nlm.nih.gov/articles/PMC6851872/
Abstract

INTRODUCTION

The limited axial coverage of many computed tomography (CT) scanners poses a high risk on false negative findings in cerebral CT-perfusion (CTP) imaging. Axial coverage may be increased by moving the table back and forth during image acquisition. However, this method often increases the acquisition interval between CT frames, which may influence the CTP analysis. In this study, we evaluated the influence of different acquisition intervals on quantitative perfusion maps and infarct volumes by analyzing patient data with three CTP analysis methods.

METHODS

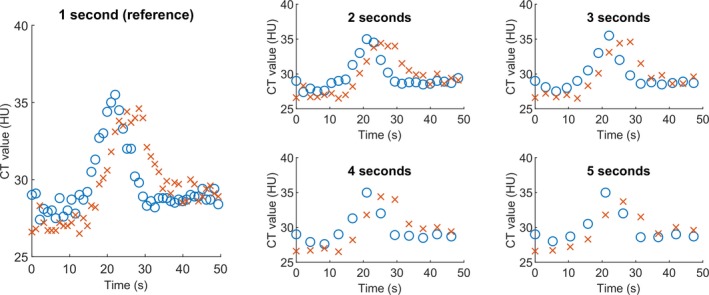
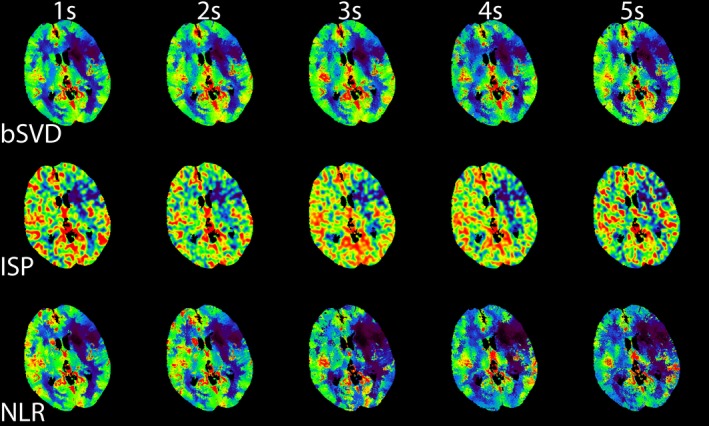
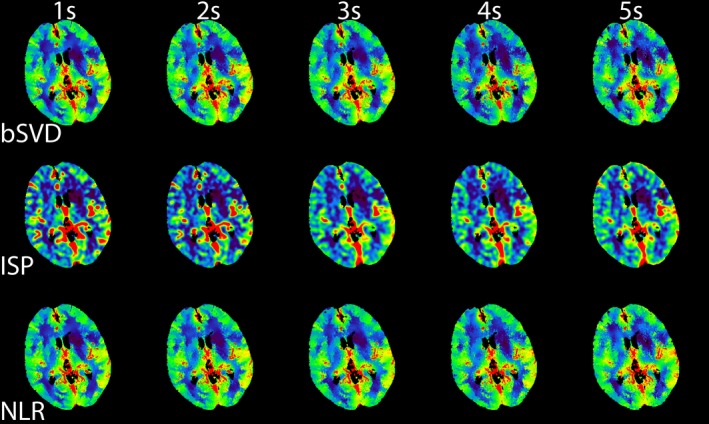
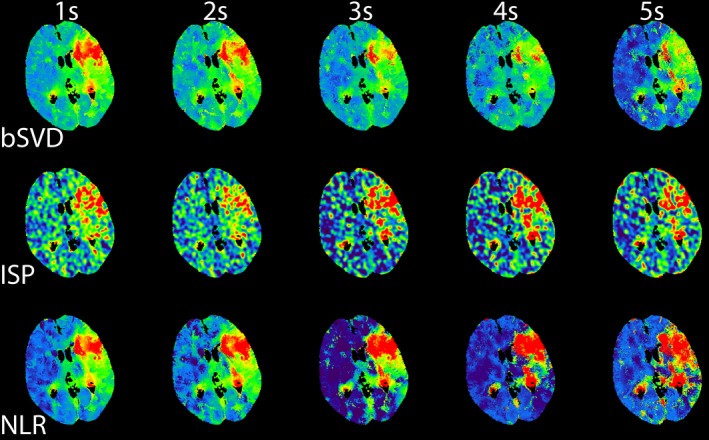
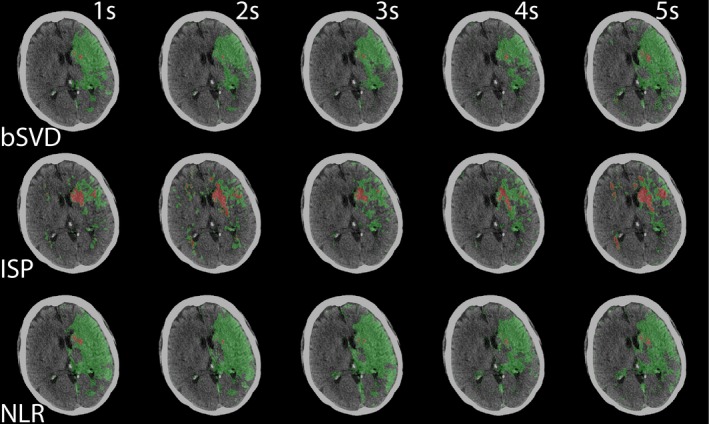
CT-perfusion data from 25 patients with ischemic stroke were used for this study. The acquisition interval was synthetically reduced from 1 to 5 s before calculating perfusion values, which included cerebral blood flow (CBF), cerebral blood volume (CBV), and mean transit time (MTT). The color scaling of the perfusion was scaled such that the mean perfusion value had the same color-coding as the mean perfusion in the 1 s reference. Also, infarct core and penumbra volumes (summary map) were calculated using default thresholds of CBV and relative MTT (rMTT). The original, 1 s acquisition interval scan served as the reference standard. A commercial block-circulant singular value decomposition (bSVD) based method (ISP; Philips Healthcare), a non-commercial bSVD method, and a non-linear regression (NLR) model-based method were evaluated.

RESULTS

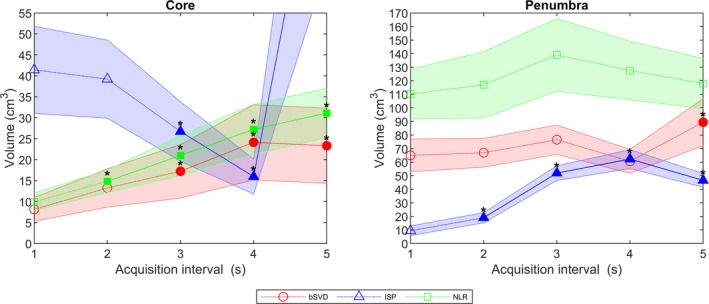
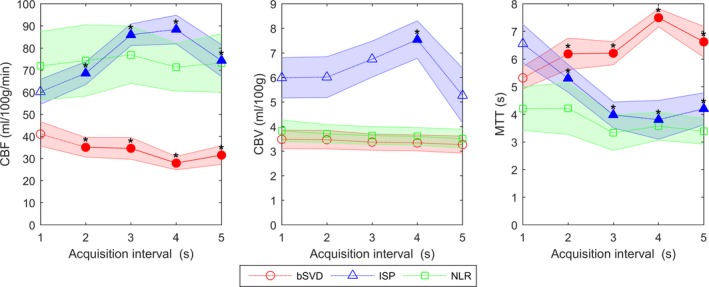
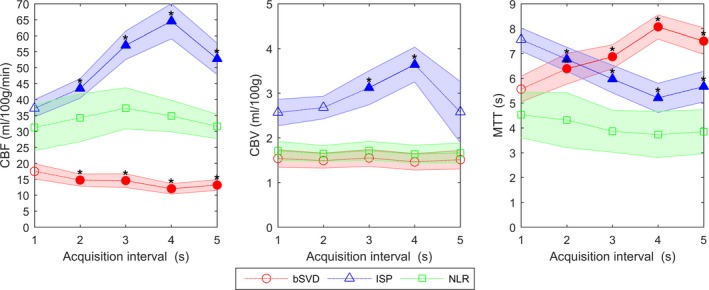
Cerebral blood volume values generated with bSVD and NLR were not significantly different from the reference standard, while ISP showed significant differences for acquisition intervals of 3 and 4 s. MTT and CBF values generated with bSVD and ISP were significantly different for all acquisition intervals, whereas NLR did not show any significant differences. Calibrated perfusion maps were able to distinguish healthy from infarcted tissue up to an acquisition interval of 5 s for all methods. The infarct core volumes were significantly different for acquisition intervals of 2 (NLR) and 3 s (bSVD and ISP) or greater. For the penumbra volumes, NLR showed no significant differences, while bSVD and ISP showed significant differences for the 5 s interval and for all intervals, respectively. Visual inspection of the summary maps indicated minor differences between the reference standard and acquisition intervals of 4 s or less (ISP) and 5 s or less (bSVD and NLR).

CONCLUSION

Altering the acquisition interval may introduce a bias in the perfusion parameters. Calibration of the visualization of the perfusion maps with increasing acquisition intervals allowed distinction between healthy and infarcted tissue. Infarct volumes based on relative MTT can be influenced by the acquisition interval, but visual inspection of the summary maps indicated minor differences between the reference standard and acquisition intervals up to 4 (ISP) and 5 s (bSVD and NLR). Taken together, axial coverage can be increased by prolonging the acquisition interval up to 5 s depending on the perfusion analysis.

摘要

简介

许多计算机断层扫描(CT)扫描仪的轴向覆盖范围有限,这使得在脑 CT 灌注(CTP)成像中出现假阴性结果的风险很高。在图像采集过程中,可以通过前后移动工作台来增加轴向覆盖范围。然而,这种方法通常会增加 CT 帧之间的采集间隔,这可能会影响 CTP 分析。在这项研究中,我们通过分析三种 CTP 分析方法的患者数据,评估了不同采集间隔对定量灌注图和梗死体积的影响。

方法

这项研究使用了 25 例缺血性脑卒中患者的 CTP 数据。在计算灌注值之前,综合将采集间隔从 1 秒缩短至 5 秒,灌注值包括脑血流量(CBF)、脑血容量(CBV)和平均通过时间(MTT)。灌注的颜色标度被缩放,使得平均灌注值的颜色编码与 1 秒参考值的平均灌注值的颜色编码相同。此外,还使用 CBV 和相对 MTT(rMTT)的默认阈值计算梗死核心和半影体积(摘要图)。原始的 1 秒采集间隔扫描作为参考标准。评估了一种基于商业循环奇异值分解(bSVD)的方法(ISP;飞利浦医疗保健公司)、一种非商业 bSVD 方法和一种基于非线性回归(NLR)模型的方法。

结果

使用 bSVD 和 NLR 生成的 CBV 值与参考标准没有显著差异,而 ISP 则显示 3 秒和 4 秒采集间隔的差异显著。使用 bSVD 和 ISP 生成的 MTT 和 CBF 值在所有采集间隔都有显著差异,而 NLR 则没有显示任何显著差异。校准后的灌注图能够在所有方法中,直到采集间隔为 5 秒,区分健康组织和梗死组织。对于采集间隔为 2 秒(NLR)和 3 秒(bSVD 和 ISP)或更长时间的梗死核心体积,差异显著。对于半影体积,NLR 没有显示出显著差异,而 bSVD 和 ISP 则显示出 5 秒间隔和所有间隔的差异显著。对摘要图的直观检查表明,参考标准和采集间隔为 4 秒或更短(ISP)和 5 秒或更短(bSVD 和 NLR)之间存在微小差异。

结论

改变采集间隔可能会对灌注参数产生偏差。通过增加采集间隔对灌注图的可视化进行校准,允许区分健康组织和梗死组织。基于相对 MTT 的梗死体积可能会受到采集间隔的影响,但对摘要图的直观检查表明,参考标准和采集间隔之间的差异较小,直到 4 秒(ISP)和 5 秒(bSVD 和 NLR)。总的来说,根据灌注分析,可以通过延长采集间隔来增加轴向覆盖范围,最长可达 5 秒。

https://cdn.ncbi.nlm.nih.gov/pmc/blobs/359b/6851872/9c56e44541cc/MP-46-3156-g008.jpg
https://cdn.ncbi.nlm.nih.gov/pmc/blobs/359b/6851872/d777b18519c1/MP-46-3156-g001.jpg
https://cdn.ncbi.nlm.nih.gov/pmc/blobs/359b/6851872/3ac0412a910e/MP-46-3156-g002.jpg
https://cdn.ncbi.nlm.nih.gov/pmc/blobs/359b/6851872/1427460923ee/MP-46-3156-g003.jpg
https://cdn.ncbi.nlm.nih.gov/pmc/blobs/359b/6851872/e4de7aad2aa9/MP-46-3156-g004.jpg
https://cdn.ncbi.nlm.nih.gov/pmc/blobs/359b/6851872/c8ee22da78e1/MP-46-3156-g005.jpg
https://cdn.ncbi.nlm.nih.gov/pmc/blobs/359b/6851872/46d278efc783/MP-46-3156-g006.jpg
https://cdn.ncbi.nlm.nih.gov/pmc/blobs/359b/6851872/dc65493dc9f9/MP-46-3156-g007.jpg
https://cdn.ncbi.nlm.nih.gov/pmc/blobs/359b/6851872/9c56e44541cc/MP-46-3156-g008.jpg

相似文献

1
Effect of prolonged acquisition intervals for CT-perfusion analysis methods in patients with ischemic stroke.CT 灌注分析方法采集时间延长对缺血性脑卒中患者的影响。
Med Phys. 2019 Jul;46(7):3156-3164. doi: 10.1002/mp.13559. Epub 2019 May 27.
2
Probability maps classify ischemic stroke regions more accurately than CT perfusion summary maps.概率图比 CT 灌注总结图更准确地分类缺血性卒中区域。
Eur Radiol. 2022 Sep;32(9):6367-6375. doi: 10.1007/s00330-022-08700-y. Epub 2022 Mar 31.
3
CT perfusion mean transit time maps optimally distinguish benign oligemia from true "at-risk" ischemic penumbra, but thresholds vary by postprocessing technique.CT 灌注平均通过时间图最佳地区分良性低灌注与真正的“危险”缺血半影区,但阈值因后处理技术而异。
AJNR Am J Neuroradiol. 2012 Mar;33(3):545-9. doi: 10.3174/ajnr.A2809. Epub 2011 Dec 22.
4
Differences in CT perfusion maps generated by different commercial software: quantitative analysis by using identical source data of acute stroke patients.不同商业软件生成的 CT 灌注图的差异:使用急性脑卒中患者相同源数据的定量分析。
Radiology. 2010 Jan;254(1):200-9. doi: 10.1148/radiol.254082000.
5
Characteristics of Misclassified CT Perfusion Ischemic Core in Patients with Acute Ischemic Stroke.急性缺血性脑卒中患者CT灌注缺血半暗带误分类的特征
PLoS One. 2015 Nov 4;10(11):e0141571. doi: 10.1371/journal.pone.0141571. eCollection 2015.
6
Incorporation of relative cerebral blood flow into CT perfusion maps reduces false 'at risk' penumbra.将相对脑血流量纳入 CT 灌注图可减少错误的“缺血半暗带”。
J Neurointerv Surg. 2018 Jul;10(7):657-662. doi: 10.1136/neurintsurg-2017-013268. Epub 2017 Sep 30.
7
Feasibility of deconvolution-based multiphase CT angiography perfusion maps in acute ischemic stroke: Simulation and concordance with CT perfusion.基于去卷积的多相 CT 血管造影灌注图在急性缺血性脑卒中的可行性:模拟与 CT 灌注的一致性。
J Stroke Cerebrovasc Dis. 2022 Dec;31(12):106844. doi: 10.1016/j.jstrokecerebrovasdis.2022.106844. Epub 2022 Oct 29.
8
Estimation of Ischemic Core Volume Using Computed Tomographic Perfusion.基于计算机断层灌注成像的缺血核心体积评估。
Stroke. 2018 Oct;49(10):2345-2352. doi: 10.1161/STROKEAHA.118.021952.
9
Defining Ischemic Core in Acute Ischemic Stroke Using CT Perfusion: A Multiparametric Bayesian-Based Model.使用 CT 灌注定义急性缺血性脑卒中的缺血核心:一种基于多参数贝叶斯的模型。
AJNR Am J Neuroradiol. 2019 Sep;40(9):1491-1497. doi: 10.3174/ajnr.A6170. Epub 2019 Aug 14.
10
Comparison of three commonly used CT perfusion software packages in patients with acute ischemic stroke.三种常用 CT 灌注软件包在急性缺血性脑卒中患者中的比较。
J Neurointerv Surg. 2019 Dec;11(12):1249-1256. doi: 10.1136/neurintsurg-2019-014822. Epub 2019 Jun 15.

引用本文的文献

1
Dual-layer spectral CT for iodine mapping and surrogate perfusion evaluation in cerebrovascular disease.双层光谱CT在脑血管疾病碘图绘制及替代灌注评估中的应用
Eur Radiol. 2025 Jul 16. doi: 10.1007/s00330-025-11858-w.
2
Perfusion Parameter Map Generation from 3 Phases of Computed Tomography Perfusion in Stroke Using Generative Adversarial Networks.使用生成对抗网络从卒中计算机断层扫描灌注的三个阶段生成灌注参数图
Research (Wash D C). 2025 Apr 30;8:0689. doi: 10.34133/research.0689. eCollection 2025.
3
A retrospective study of non-equidistant interstitial brain CT perfusion scanning and prediction of time to peak.

本文引用的文献

1
Thrombectomy for Stroke at 6 to 16 Hours with Selection by Perfusion Imaging.6至16小时卒中的血栓切除术及灌注成像选择
N Engl J Med. 2018 Feb 22;378(8):708-718. doi: 10.1056/NEJMoa1713973. Epub 2018 Jan 24.
2
Thrombectomy 6 to 24 Hours after Stroke with a Mismatch between Deficit and Infarct.发病后 6 至 24 小时内进行取栓术治疗与缺损和梗死不匹配的脑卒中。
N Engl J Med. 2018 Jan 4;378(1):11-21. doi: 10.1056/NEJMoa1706442. Epub 2017 Nov 11.
3
Whole-brain CT perfusion imaging using increased sampling intervals: A pilot study.使用增加采样间隔的全脑CT灌注成像:一项初步研究。
非等间距脑实质CT灌注扫描的回顾性研究及达峰时间预测
Heliyon. 2024 Jan 20;10(2):e24758. doi: 10.1016/j.heliyon.2024.e24758. eCollection 2024 Jan 30.
4
Multiphase CT angiography perfusion maps for predicting target mismatch and ischemic lesion volumes.多相 CT 血管造影灌注图预测靶标不匹配和缺血性病变体积。
Sci Rep. 2023 Dec 11;13(1):21976. doi: 10.1038/s41598-023-48832-9.
5
Standardizing the estimation of ischemic regions can harmonize CT perfusion stroke imaging.标准化缺血区域的评估可以使 CT 灌注卒中成像更加协调。
Eur Radiol. 2024 Feb;34(2):797-807. doi: 10.1007/s00330-023-10035-1. Epub 2023 Aug 12.
6
Inferring CT perfusion parameters and uncertainties using a Bayesian approach.使用贝叶斯方法推断CT灌注参数及不确定性。
Quant Imaging Med Surg. 2022 Jan;12(1):439-456. doi: 10.21037/qims-21-338.
Exp Ther Med. 2017 Sep;14(3):2643-2649. doi: 10.3892/etm.2017.4816. Epub 2017 Jul 19.
4
Fast nonlinear regression method for CT brain perfusion analysis.用于CT脑灌注分析的快速非线性回归方法
J Med Imaging (Bellingham). 2016 Apr;3(2):026003. doi: 10.1117/1.JMI.3.2.026003. Epub 2016 Jun 16.
5
International survey of acute stroke imaging used to make revascularization treatment decisions.用于做出血管再通治疗决策的急性卒中影像学国际调查。
Int J Stroke. 2015 Jul;10(5):759-62. doi: 10.1111/ijs.12491. Epub 2015 Apr 2.
6
Whole brain CT perfusion in acute anterior circulation ischemia: coverage size matters.急性前循环缺血中的全脑CT灌注:覆盖范围很重要。
Neuroradiology. 2014 Dec;56(12):1121-6. doi: 10.1007/s00234-014-1429-9. Epub 2014 Sep 17.
7
Radiation dose reduction in cerebral CT perfusion imaging using iterative reconstruction.使用迭代重建技术降低脑CT灌注成像中的辐射剂量
Eur Radiol. 2014 Feb;24(2):484-93. doi: 10.1007/s00330-013-3042-4. Epub 2013 Oct 15.
8
Diagnostic accuracy of CT perfusion imaging for detecting acute ischemic stroke: a systematic review and meta-analysis.CT 灌注成像诊断急性缺血性卒中的准确性:系统评价和荟萃分析。
Cerebrovasc Dis. 2013;35(6):493-501. doi: 10.1159/000350200. Epub 2013 May 31.
9
CT perfusion in acute ischemic stroke: a comparison of 2-second and 1-second temporal resolution.CT 灌注在急性缺血性脑卒中中的应用:2 秒和 1 秒时间分辨率的比较。
AJNR Am J Neuroradiol. 2011 Oct;32(9):1632-9. doi: 10.3174/ajnr.A2576. Epub 2011 Aug 4.
10
Validation of CT brain perfusion methods using a realistic dynamic head phantom.使用逼真的动态头颅体模验证 CT 脑灌注方法。
Med Phys. 2011 Jun;38(6):3212-21. doi: 10.1118/1.3592639.