Department of Radiation Oncology, Division of Medical Physics, Medical Centre, Faculty of Medicine, University of Freiburg, Robert-Koch-Str. 3, 79106, Freiburg, Germany.
German Cancer Consortium (DKTK) Partner Site Freiburg, German Cancer Research Centre (DKFZ), Heidelberg, Germany.
Radiat Oncol. 2020 Oct 20;15(1):242. doi: 10.1186/s13014-020-01683-4.
To evaluate the applicability and estimate the radiobiological parameters of linear-quadratic Poisson tumour control probability (TCP) model for primary prostate cancer patients for two relevant target structures (prostate gland and GTV). The TCP describes the dose-response of prostate after definitive radiotherapy (RT). Also, to analyse and identify possible significant correlations between clinical and treatment factors such as planned dose to prostate gland, dose to GTV, volume of prostate and mpMRI-GTV based on multivariate logistic regression model.
The study included 129 intermediate and high-risk prostate cancer patients (cN0 and cM0), who were treated with image-guided intensity modulated radiotherapy (IMRT) ± androgen deprivation therapy with a median follow-up period of 81.4 months (range 42.0-149.0) months. Tumour control was defined as biochemical relapse free survival according to the Phoenix definition (BRFS). MpMRI-GTV was delineated retrospectively based on a pre-treatment multi-parametric MR imaging (mpMRI), which was co-registered to the planning CT. The clinical treatment planning procedure was based on prostate gland, delineated on CT imaging modality. Furthermore, we also fitted the clinical data to TCP model for the two considered targets for the 5-year follow-up after radiation treatment, where our cohort was composed of a total number of 108 patients, of which 19 were biochemical relapse (BR) patients.
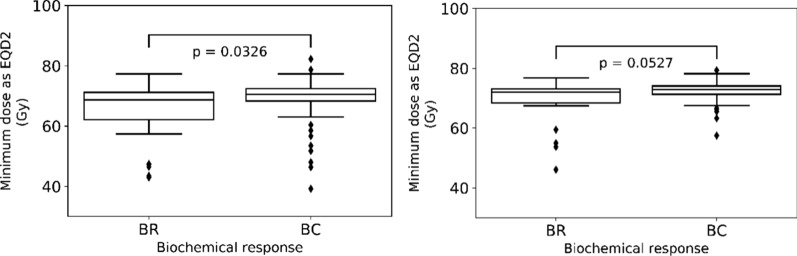
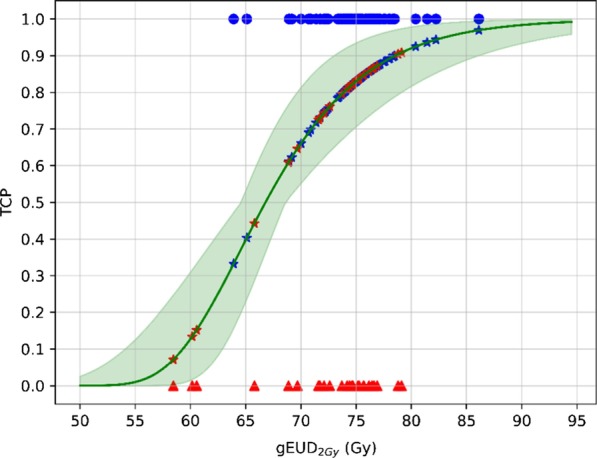
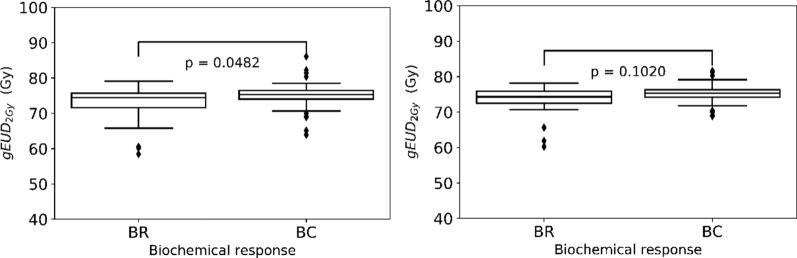
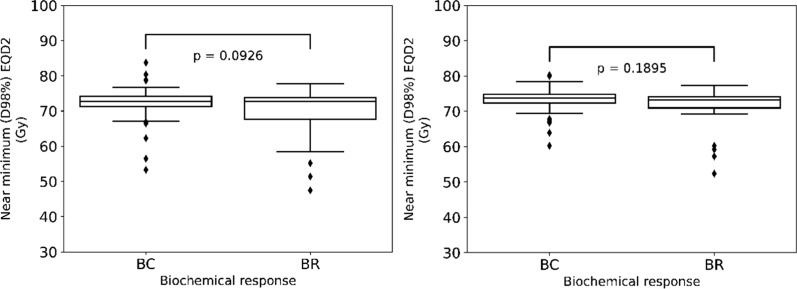
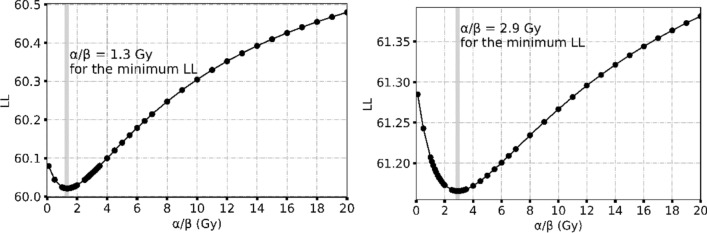
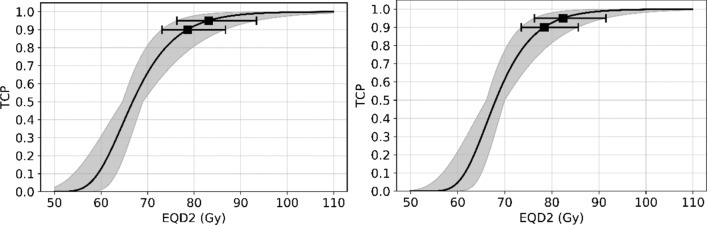
For the median follow-up period of 81.4 months (range 42.0-149.0) months, our results indicated an appropriate α/β = 1.3 Gy for prostate gland and α/β = 2.9 Gy for mpMRI-GTV. Only for prostate gland, EQD2 and gEUD2Gy were significantly lower in the biochemical relapse (BR) group compared to the biochemical control (BC) group. Fitting results to the linear-quadratic Poisson TCP model for prostate gland and α/β = 1.3 Gy were D = 66.8 Gy with 95% CI [64.6 Gy, 69.0 Gy], and γ = 3.8 with 95% CI [2.6, 5.2]. For mpMRI-GTV and α/β = 2.9 Gy, D was 68.1 Gy with 95% CI [66.1 Gy, 70.0 Gy], and γ = 4.5 with 95% CI [3.0, 6.1]. Finally, for the 5-year follow-up after the radiation treatment, our results for the prostate gland were: D = 64.6 Gy [61.6 Gy, 67.4 Gy], γ = 3.1 [2.0, 4.4], α/β = 2.2 Gy (95% CI was undefined). For the mpMRI-GTV, the optimizer was unable to deliver any reasonable results for the expected clinical D and α/β. The results for the mpMRI-GTV were D = 50.1 Gy [44.6 Gy, 56.0 Gy], γ = 0.8 [0.5, 1.2], α/β = 0.0 Gy (95% CI was undefined). For a follow-up time of 5 years and a fixed α/β = 1.6 Gy, the TCP fitting results for prostate gland were D = 63.9 Gy [60.8 Gy, 67.0 Gy], γ = 2.9 [1.9, 4.1], and for mpMRI-GTV D = 56.3 Gy [51.6 Gy, 61.1 Gy], γ = 1.3 [0.8, 1.9].
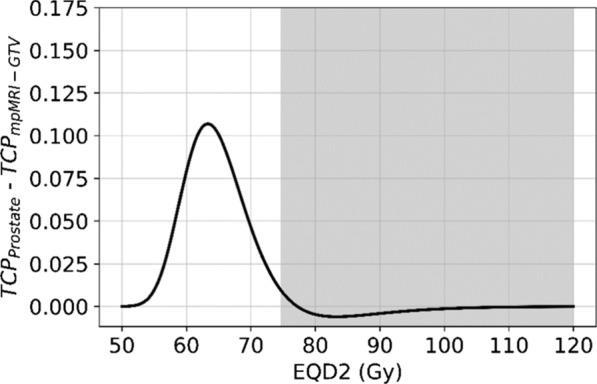
The linear-quadratic Poisson TCP model was better fit when the prostate gland was considered as responsible target than with mpMRI-GTV. This is compatible with the results of the comparison of the dose distributions among BR and BC groups and with the results achieved with the multivariate logistic model regarding gEUD. Probably limitations of mpMRI in defining the GTV explain these results. Another explanation could be the relatively homogeneous dose prescription and the relatively low number of recurrences. The failure to identify any benefit for considering mpMRI-GTV as the target responsible for the clinical response is confirmed when considering a fixed α/β = 1.6 Gy, a fixed follow-up time for biochemical response at 5 years or Gleason score differentiation.
评估线性二次泊松肿瘤控制概率(TCP)模型在原发性前列腺癌患者两种相关靶区(前列腺和 GTV)中的适用性,并估计其放射生物学参数。TCP 描述了前列腺在根治性放疗(RT)后的剂量反应。此外,通过多变量逻辑回归模型分析并识别与临床和治疗因素之间可能存在的显著相关性,如前列腺计划剂量、GTV 剂量、前列腺体积和基于 mpMRI-GTV 的剂量。
本研究纳入了 129 例中高危前列腺癌患者(cN0 和 cM0),他们接受了图像引导调强放疗(IMRT)±雄激素剥夺治疗,中位随访时间为 81.4 个月(范围 42.0-149.0)个月。肿瘤控制定义为根据凤凰定义(BRFS)的生化无复发生存。mpMRI-GTV 是基于治疗前多参数磁共振成像(mpMRI)进行回顾性勾画的,该成像与计划 CT 进行了配准。临床治疗计划程序是基于 CT 成像模式勾画前列腺。此外,我们还将临床数据拟合到 TCP 模型中,用于放射治疗后 5 年的两个考虑目标,我们的队列由总共 108 名患者组成,其中 19 名是生化复发(BR)患者。
在中位随访时间为 81.4 个月(范围 42.0-149.0)个月期间,我们的结果表明前列腺的合适 α/β 值为 1.3 Gy,mpMRI-GTV 的合适 α/β 值为 2.9 Gy。仅在前列腺方面,生化复发(BR)组的 EQD2 和 gEUD2Gy 明显低于生化控制(BC)组。将线性二次泊松 TCP 模型拟合到前列腺和 α/β 值为 1.3 Gy 的结果为 D = 66.8 Gy [64.6 Gy,69.0 Gy],γ = 3.8 [2.6 Gy,5.2 Gy]。对于 mpMRI-GTV 和 α/β 值为 2.9 Gy,D 为 68.1 Gy [66.1 Gy,70.0 Gy],γ = 4.5 [3.0 Gy,6.1 Gy]。最后,对于放射治疗后 5 年的随访,我们对前列腺的结果为:D = 64.6 Gy [61.6 Gy,67.4 Gy],γ = 3.1 [2.0 Gy,4.4 Gy],α/β = 2.2 Gy(95% CI 未定义)。对于 mpMRI-GTV,优化器无法为预期的临床 D 和 α/β 提供任何合理的结果。mpMRI-GTV 的结果为 D = 50.1 Gy [44.6 Gy,56.0 Gy],γ = 0.8 [0.5 Gy,1.2 Gy],α/β = 0.0 Gy(95% CI 未定义)。对于 5 年的随访时间和固定的 α/β 值为 1.6 Gy,前列腺的 TCP 拟合结果为 D = 63.9 Gy [60.8 Gy,67.0 Gy],γ = 2.9 [1.9 Gy,4.1 Gy],mpMRI-GTV 的 D = 56.3 Gy [51.6 Gy,61.1 Gy],γ = 1.3 [0.8 Gy,1.9 Gy]。
当考虑前列腺作为靶区时,线性二次泊松 TCP 模型的拟合效果更好,而不是考虑 mpMRI-GTV。这与 BR 和 BC 组之间剂量分布的比较结果以及 gEUD 方面的多变量逻辑模型结果相吻合。可能是由于 mpMRI 在定义 GTV 方面的局限性,导致了这些结果。另一个解释可能是相对均匀的剂量处方和相对较低的复发率。当考虑固定的 α/β 值为 1.6 Gy、生化反应的固定随访时间为 5 年或 Gleason 评分差异时,确定将 mpMRI-GTV 作为临床反应的靶区没有任何益处,这一结果得到了证实。