• 文献检索
  • 文档翻译
  • 深度研究
  • 学术资讯
  • Suppr Zotero 插件Zotero 插件
  • 邀请有礼
  • 套餐&价格
  • 历史记录
应用&插件
Suppr Zotero 插件Zotero 插件浏览器插件Mac 客户端Windows 客户端微信小程序
定价
高级版会员购买积分包购买API积分包
服务
文献检索文档翻译深度研究API 文档MCP 服务
关于我们
关于 Suppr公司介绍联系我们用户协议隐私条款
关注我们

Suppr 超能文献

核心技术专利:CN118964589B侵权必究
粤ICP备2023148730 号-1Suppr @ 2026

文献检索

告别复杂PubMed语法,用中文像聊天一样搜索,搜遍4000万医学文献。AI智能推荐,让科研检索更轻松。

立即免费搜索

文件翻译

保留排版,准确专业,支持PDF/Word/PPT等文件格式,支持 12+语言互译。

免费翻译文档

深度研究

AI帮你快速写综述,25分钟生成高质量综述,智能提取关键信息,辅助科研写作。

立即免费体验

为风险调整后的累积和控制图建立患者组合模型。

Modeling the patient mix for risk-adjusted CUSUM charts.

作者信息

Wittenberg Philipp

机构信息

Department of Mathematics and Statistics, Helmut Schmidt University, Germany.

出版信息

Stat Methods Med Res. 2022 May;31(5):779-800. doi: 10.1177/09622802211053205. Epub 2022 Mar 10.

DOI:10.1177/09622802211053205
PMID:35139722
原文链接:https://pmc.ncbi.nlm.nih.gov/articles/PMC9014690/
Abstract

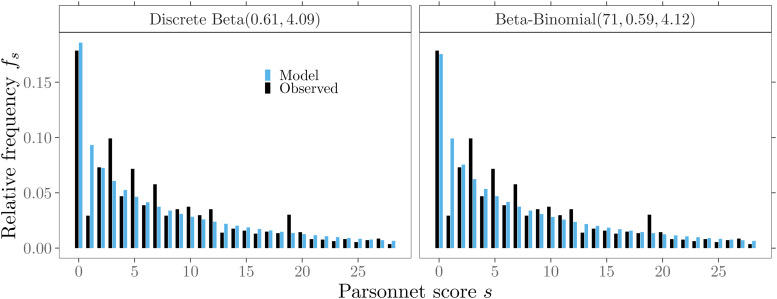
The improvement of surgical quality and the corresponding early detection of its changes is of increasing importance. To this end, sequential monitoring procedures such as the risk-adjusted CUmulative SUM chart are frequently applied. The patient risk score population (patient mix), which considers the patients' perioperative risk, is a core component for this type of quality control chart. Consequently, it is important to be able to adapt different shapes of patient mixes and determine their impact on the monitoring scheme. This article proposes a framework for modeling the patient mix by a discrete beta-binomial and a continuous beta distribution for risk-adjusted CUSUM charts. Since the model-based approach is not limited by data availability, patient mix can be analyzed. We examine the effects on the control chart's false alarm behavior for more than 100,000 different scenarios for a cardiac surgery data set. Our study finds a negative relationship between the average risk score and the number of false alarms. The results indicate that a changing patient mix has a considerable impact and, in some cases, almost doubles the number of expected false alarms.

摘要

手术质量的提高以及对其变化的相应早期检测变得越来越重要。为此,诸如风险调整累积和图等序贯监测程序经常被应用。考虑患者围手术期风险的患者风险评分群体(患者组合)是这类质量控制图的核心组成部分。因此,能够适应不同形状的患者组合并确定它们对监测方案的影响很重要。本文提出了一个框架,用于通过离散贝塔 - 二项分布和连续贝塔分布对风险调整累积和图的患者组合进行建模。由于基于模型的方法不受数据可用性的限制,因此可以分析患者组合。我们针对一个心脏手术数据集,在超过100,000种不同情况下检查了对控制图误报行为的影响。我们的研究发现平均风险评分与误报数量之间存在负相关关系。结果表明,变化的患者组合具有相当大的影响,在某些情况下,预期误报数量几乎翻倍。

https://cdn.ncbi.nlm.nih.gov/pmc/blobs/dadc/9014690/930c9a03f358/10.1177_09622802211053205-fig13.jpg
https://cdn.ncbi.nlm.nih.gov/pmc/blobs/dadc/9014690/fa7c6aadae52/10.1177_09622802211053205-fig1.jpg
https://cdn.ncbi.nlm.nih.gov/pmc/blobs/dadc/9014690/47869ee4e4f0/10.1177_09622802211053205-fig2.jpg
https://cdn.ncbi.nlm.nih.gov/pmc/blobs/dadc/9014690/36d2750ab5d9/10.1177_09622802211053205-fig3.jpg
https://cdn.ncbi.nlm.nih.gov/pmc/blobs/dadc/9014690/2555ebd9da22/10.1177_09622802211053205-fig4.jpg
https://cdn.ncbi.nlm.nih.gov/pmc/blobs/dadc/9014690/8603d6e9608c/10.1177_09622802211053205-fig5.jpg
https://cdn.ncbi.nlm.nih.gov/pmc/blobs/dadc/9014690/e8c4e1b85f9a/10.1177_09622802211053205-fig6.jpg
https://cdn.ncbi.nlm.nih.gov/pmc/blobs/dadc/9014690/f4f3f974c875/10.1177_09622802211053205-fig7.jpg
https://cdn.ncbi.nlm.nih.gov/pmc/blobs/dadc/9014690/31d5848204ff/10.1177_09622802211053205-fig8.jpg
https://cdn.ncbi.nlm.nih.gov/pmc/blobs/dadc/9014690/12b087dfb4ef/10.1177_09622802211053205-fig9.jpg
https://cdn.ncbi.nlm.nih.gov/pmc/blobs/dadc/9014690/1ecc5a70c9f2/10.1177_09622802211053205-fig10.jpg
https://cdn.ncbi.nlm.nih.gov/pmc/blobs/dadc/9014690/0b0e98a6a9d9/10.1177_09622802211053205-fig11.jpg
https://cdn.ncbi.nlm.nih.gov/pmc/blobs/dadc/9014690/d2622cfb911b/10.1177_09622802211053205-fig12.jpg
https://cdn.ncbi.nlm.nih.gov/pmc/blobs/dadc/9014690/930c9a03f358/10.1177_09622802211053205-fig13.jpg

相似文献

1
Modeling the patient mix for risk-adjusted CUSUM charts.为风险调整后的累积和控制图建立患者组合模型。
Stat Methods Med Res. 2022 May;31(5):779-800. doi: 10.1177/09622802211053205. Epub 2022 Mar 10.
2
Monitoring binary outcomes using risk-adjusted charts: a comparative study.使用风险调整图表监测二分类结局:一项比较研究。
Stat Med. 2011 Oct 15;30(23):2815-26. doi: 10.1002/sim.4305. Epub 2011 Jul 22.
3
Dynamic probability control limits for risk-adjusted Bernoulli CUSUM charts.风险调整后的伯努利累积和控制图的动态概率控制限
Stat Med. 2015 Nov 10;34(25):3336-48. doi: 10.1002/sim.6547. Epub 2015 Jun 3.
4
Dynamic probability control limits for risk-adjusted CUSUM charts based on multiresponses.基于多响应的风险调整累积和控制图的动态概率控制限
Stat Med. 2017 Jul 20;36(16):2547-2558. doi: 10.1002/sim.7312. Epub 2017 Apr 19.
5
Risk-adjusted CUSUM charts under model error.模型错误下的风险调整累积和图。
Stat Med. 2019 May 30;38(12):2206-2218. doi: 10.1002/sim.8104. Epub 2019 Feb 5.
6
Use of risk-adjusted CUSUM charts to monitor 30-day mortality in Danish hospitals.使用风险调整后的累积和控制图监测丹麦医院的30天死亡率。
Clin Epidemiol. 2018 Apr 18;10:445-456. doi: 10.2147/CLEP.S157162. eCollection 2018.
7
Risk-adjusted zero-inflated Poisson CUSUM charts for monitoring influenza surveillance data.用于监测流感监测数据的风险调整零膨胀泊松 CUSUM 图。
BMC Med Inform Decis Mak. 2021 Jul 30;21(Suppl 2):96. doi: 10.1186/s12911-021-01443-8.
8
The impact of varying patient populations on the in-control performance of the risk-adjusted CUSUM chart.不同患者群体对风险调整CUSUM图的在控性能的影响。
Int J Qual Health Care. 2015 Feb;27(1):31-6. doi: 10.1093/intqhc/mzu092. Epub 2014 Dec 8.
9
Statistical process monitoring to improve quality assurance of inpatient care.统计过程监测,提高住院护理质量保证。
BMC Health Serv Res. 2020 Jan 7;20(1):21. doi: 10.1186/s12913-019-4866-7.
10
Monitoring surgical and medical outcomes: the Bernoulli cumulative SUM chart. A novel application to assess clinical interventions.监测手术和医疗结果:伯努利累积和控制图。评估临床干预措施的一种新应用。
Postgrad Med J. 2005 Oct;81(960):647-52. doi: 10.1136/pgmj.2004.030619.

本文引用的文献

1
A Fast Online Monitoring Approach for Surgical Risks.一种用于手术风险的快速在线监测方法。
Math Biosci Eng. 2020 Apr 16;17(4):3130-3146. doi: 10.3934/mbe.2020177.
2
Risk-adjusted CUSUM charts under model error.模型错误下的风险调整累积和图。
Stat Med. 2019 May 30;38(12):2206-2218. doi: 10.1002/sim.8104. Epub 2019 Feb 5.
3
A simple signaling rule for variable life-adjusted display derived from an equivalent risk-adjusted CUSUM chart.一种源自等效风险调整 CUSUM 图的变量生命调整显示的简单信号规则。
Stat Med. 2018 Jul 20;37(16):2455-2473. doi: 10.1002/sim.7647. Epub 2018 Apr 17.
4
Monitoring the quality of cardiac surgery based on three or more surgical outcomes using a new variable life-adjusted display.使用一种新的可变寿命调整显示法,基于三种或更多手术结果监测心脏手术质量。
Int J Qual Health Care. 2017 Jun 1;29(3):427-432. doi: 10.1093/intqhc/mzx033.
5
Dynamic probability control limits for risk-adjusted Bernoulli CUSUM charts.风险调整后的伯努利累积和控制图的动态概率控制限
Stat Med. 2015 Nov 10;34(25):3336-48. doi: 10.1002/sim.6547. Epub 2015 Jun 3.
6
The impact of varying patient populations on the in-control performance of the risk-adjusted CUSUM chart.不同患者群体对风险调整CUSUM图的在控性能的影响。
Int J Qual Health Care. 2015 Feb;27(1):31-6. doi: 10.1093/intqhc/mzu092. Epub 2014 Dec 8.
7
Risk assessment methods for cardiac surgery and intervention.心脏手术和介入的风险评估方法。
Nat Rev Cardiol. 2014 Dec;11(12):704-14. doi: 10.1038/nrcardio.2014.136. Epub 2014 Sep 23.
8
A new risk-adjusted Bernoulli cumulative sum chart for monitoring binary health data.一种用于监测二元健康数据的新的风险调整伯努利累积和图。
Stat Methods Med Res. 2016 Dec;25(6):2704-2713. doi: 10.1177/0962280214530883. Epub 2014 Apr 22.
9
Monitoring risk-adjusted medical outcomes allowing for changes over time.监测经风险调整的医疗结果,同时考虑随时间的变化。
Biostatistics. 2014 Oct;15(4):665-76. doi: 10.1093/biostatistics/kxt057. Epub 2013 Dec 29.
10
Assessing the effect of estimation error on risk-adjusted CUSUM chart performance.评估估计误差对风险调整 CUSUM 图性能的影响。
Int J Qual Health Care. 2012 Apr;24(2):176-81. doi: 10.1093/intqhc/mzr082. Epub 2011 Dec 21.