• 文献检索
  • 文档翻译
  • 深度研究
  • 学术资讯
  • Suppr Zotero 插件Zotero 插件
  • 邀请有礼
  • 套餐&价格
  • 历史记录
应用&插件
Suppr Zotero 插件Zotero 插件浏览器插件Mac 客户端Windows 客户端微信小程序
定价
高级版会员购买积分包购买API积分包
服务
文献检索文档翻译深度研究API 文档MCP 服务
关于我们
关于 Suppr公司介绍联系我们用户协议隐私条款
关注我们

Suppr 超能文献

核心技术专利:CN118964589B侵权必究
粤ICP备2023148730 号-1Suppr @ 2026

文献检索

告别复杂PubMed语法,用中文像聊天一样搜索,搜遍4000万医学文献。AI智能推荐,让科研检索更轻松。

立即免费搜索

文件翻译

保留排版,准确专业,支持PDF/Word/PPT等文件格式,支持 12+语言互译。

免费翻译文档

深度研究

AI帮你快速写综述,25分钟生成高质量综述,智能提取关键信息,辅助科研写作。

立即免费体验

从卫星观测的大型一氧化碳排放源:与网格化全球排放清单的比较

Large CO Emitters as Seen From Satellite: Comparison to a Gridded Global Emission Inventory.

作者信息

Chevallier Frédéric, Broquet Grégoire, Zheng Bo, Ciais Philippe, Eldering Annmarie

机构信息

Laboratoire des Sciences du Climat et de l'Environnement LSCE/IPSL CEA-CNRS-UVSQ Université Paris-Saclay Gif-sur-Yvette France.

Institute of Environment and Ecology Tsinghua Shenzhen International Graduate School Tsinghua University Shenzhen China.

出版信息

Geophys Res Lett. 2022 Mar 16;49(5):e2021GL097540. doi: 10.1029/2021GL097540. Epub 2022 Mar 11.

DOI:10.1029/2021GL097540
PMID:35859934
原文链接:https://pmc.ncbi.nlm.nih.gov/articles/PMC9285415/
Abstract

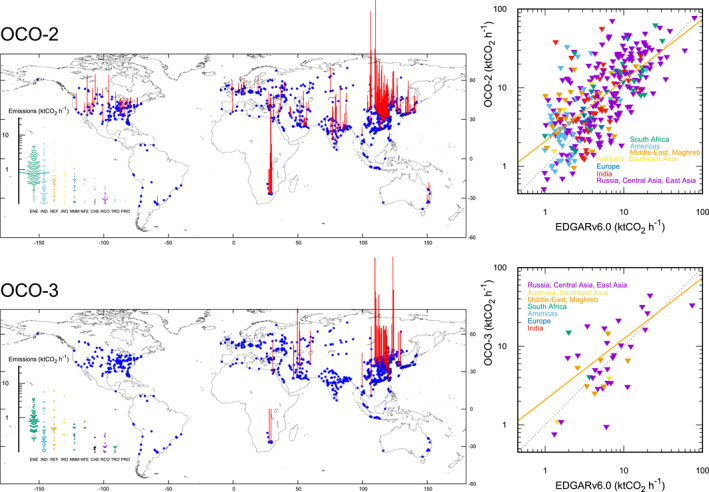
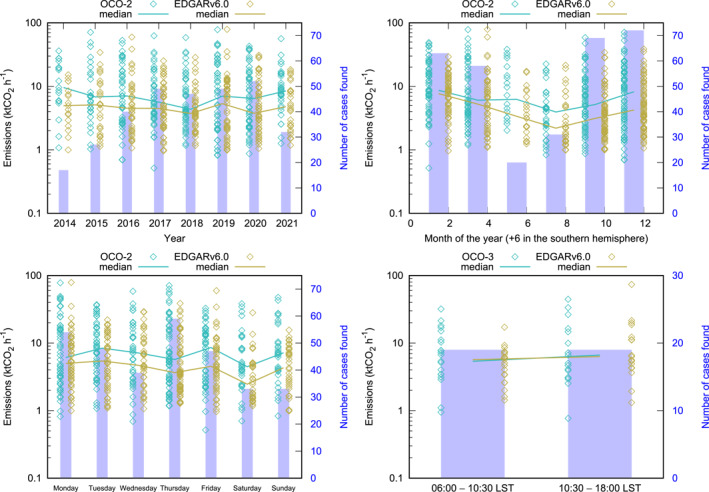
Using the multiyear archive of the two Orbiting Carbon Observatories (OCO) of NASA, we have retrieved large fossil fuel CO emissions (larger than 1.0 ktCO h per 10 square degree grid cell) over the globe with a simple plume cross-sectional inversion approach. We have compared our results with a global gridded and hourly inventory. The corresponding OCO emission retrievals explain more than one third of the inventory variance at the corresponding cells and hours. We have binned the data at diverse time scales from the year (with OCO-2) to the average morning and afternoon (with OCO-3). We see consistent variations of the median emissions, indicating that the retrieval-inventory differences (with standard deviations of a few tens of percent) are mostly random and that trends can be calculated robustly in areas of favorable observing conditions, when the future satellite CO imagers provide an order of magnitude more data.

摘要

利用美国国家航空航天局(NASA)两颗轨道碳观测卫星(OCO)的多年存档数据,我们采用一种简单的羽流横截面反演方法,获取了全球范围内大量的化石燃料一氧化碳排放数据(每10平方度网格单元大于1.0 ktCO₂/h)。我们将结果与全球网格化的每小时排放清单进行了比较。相应的OCO排放反演结果解释了相应单元格和时间点清单方差的三分之一以上。我们将数据按从年(利用OCO - 2)到平均上午和下午(利用OCO - 3)等不同时间尺度进行了分类。我们看到中位数排放呈现出一致的变化,这表明反演 - 清单差异(标准差为几十百分比)大多是随机的,并且当未来的卫星一氧化碳成像仪能提供多一个数量级的数据时,在有利观测条件的区域可以可靠地计算出趋势。

https://cdn.ncbi.nlm.nih.gov/pmc/blobs/d1ac/9285415/247c0689b3bc/GRL-49-0-g002.jpg
https://cdn.ncbi.nlm.nih.gov/pmc/blobs/d1ac/9285415/4ee40f21d423/GRL-49-0-g001.jpg
https://cdn.ncbi.nlm.nih.gov/pmc/blobs/d1ac/9285415/247c0689b3bc/GRL-49-0-g002.jpg
https://cdn.ncbi.nlm.nih.gov/pmc/blobs/d1ac/9285415/4ee40f21d423/GRL-49-0-g001.jpg
https://cdn.ncbi.nlm.nih.gov/pmc/blobs/d1ac/9285415/247c0689b3bc/GRL-49-0-g002.jpg

相似文献

1
Large CO Emitters as Seen From Satellite: Comparison to a Gridded Global Emission Inventory.从卫星观测的大型一氧化碳排放源:与网格化全球排放清单的比较
Geophys Res Lett. 2022 Mar 16;49(5):e2021GL097540. doi: 10.1029/2021GL097540. Epub 2022 Mar 11.
2
The Open-source Data Inventory for Anthropogenic Carbon dioxide (CO), version 2016 (ODIAC2016): A global, monthly fossil-fuel CO gridded emission data product for tracer transport simulations and surface flux inversions.人为二氧化碳(CO)开源数据清单,2016版(ODIAC2016):一种用于示踪剂传输模拟和表面通量反演的全球月度化石燃料CO网格化排放数据产品。
Earth Syst Sci Data. 2018;10(1):87-107. doi: 10.5194/essd-10-87-2018. Epub 2018 Jan 18.
3
Improved estimation of CO emissions from thermal power plants based on OCO-2 XCO retrieval using inline plume simulation.基于使用在线羽流模拟的OCO-2 XCO反演改进对热电厂CO排放的估算。
Sci Total Environ. 2024 Feb 25;913:169586. doi: 10.1016/j.scitotenv.2023.169586. Epub 2023 Dec 29.
4
Using Space-Based Observations and Lagrangian Modeling to Evaluate Urban Carbon Dioxide Emissions in the Middle East.利用天基观测和拉格朗日模型评估中东地区城市二氧化碳排放量
J Geophys Res Atmos. 2020 Apr 16;125(7):e2019JD031922. doi: 10.1029/2019JD031922. Epub 2020 Apr 4.
5
The potential of a constellation of low earth orbit satellite imagers to monitor worldwide fossil fuel CO emissions from large cities and point sources.一组低地球轨道卫星成像仪监测大城市和点源全球化石燃料二氧化碳排放的潜力。
Carbon Balance Manag. 2020 Sep 4;15(1):18. doi: 10.1186/s13021-020-00153-4.
6
Local Anomalies in the Column-Averaged Dry Air Mole Fractions of Carbon Dioxide Across the Globe During the First Months of the Coronavirus Recession.新冠疫情衰退头几个月全球柱状平均二氧化碳干空气摩尔分数的局部异常情况。
Geophys Res Lett. 2020 Nov 28;47(22):e2020GL090244. doi: 10.1029/2020GL090244. Epub 2020 Nov 18.
7
Near-real-time global gridded daily CO emissions.近实时全球网格化每日一氧化碳排放量。
Innovation (Camb). 2021 Nov 2;3(1):100182. doi: 10.1016/j.xinn.2021.100182. eCollection 2022 Jan 25.
8
Comparing a global high-resolution downscaled fossil fuel CO emission dataset to local inventory-based estimates over 14 global cities.将一个全球高分辨率降尺度化石燃料二氧化碳排放数据集与基于本地清单估算的14个全球城市的排放数据进行比较。
Carbon Balance Manag. 2020 May 19;15(1):9. doi: 10.1186/s13021-020-00146-3.
9
Seasonal dynamics and impact factors of atmospheric CO concentration over subtropical forest canopies: observation from eddy covariance tower and OCO-2 satellite in Northwest Himalaya, India.印度喜马拉雅山西北部亚热带林冠层大气 CO 浓度的季节动态及其影响因素:涡度相关塔和 OCO-2 卫星观测。
Environ Monit Assess. 2021 Feb 2;193(2):106. doi: 10.1007/s10661-021-08896-4.
10
CO emissions from C40 cities: citywide emission inventories and comparisons with global gridded emission datasets.C40城市的一氧化碳排放:全市排放清单及与全球网格化排放数据集的比较
Environ Res Lett. 2023 Mar 1;18(3):034032. doi: 10.1088/1748-9326/acbb91. Epub 2023 Feb 28.

引用本文的文献

1
Applying Gaussian Process Machine Learning and Modern Probabilistic Programming to Satellite Data to Infer CO Emissions.应用高斯过程机器学习和现代概率编程处理卫星数据以推断一氧化碳排放量。
Environ Sci Technol. 2025 Mar 11;59(9):4376-4387. doi: 10.1021/acs.est.4c09395. Epub 2025 Feb 24.
2
Improved estimation of carbon dioxide and methane using machine learning with satellite observations over the Arabian Peninsula.利用机器学习结合阿拉伯半岛卫星观测数据改进二氧化碳和甲烷的估算。
Sci Rep. 2025 Jan 4;15(1):766. doi: 10.1038/s41598-024-84593-9.
3
CO emissions from C40 cities: citywide emission inventories and comparisons with global gridded emission datasets.

本文引用的文献

1
Local Anomalies in the Column-Averaged Dry Air Mole Fractions of Carbon Dioxide Across the Globe During the First Months of the Coronavirus Recession.新冠疫情衰退头几个月全球柱状平均二氧化碳干空气摩尔分数的局部异常情况。
Geophys Res Lett. 2020 Nov 28;47(22):e2020GL090244. doi: 10.1029/2020GL090244. Epub 2020 Nov 18.
2
Large and seasonally varying biospheric CO fluxes in the Los Angeles megacity revealed by atmospheric radiocarbon.大气放射性碳揭示了洛杉矶大都市区中大量且季节性变化的生物圈 CO 通量。
Proc Natl Acad Sci U S A. 2020 Oct 27;117(43):26681-26687. doi: 10.1073/pnas.2005253117. Epub 2020 Oct 12.
3
C40城市的一氧化碳排放:全市排放清单及与全球网格化排放数据集的比较
Environ Res Lett. 2023 Mar 1;18(3):034032. doi: 10.1088/1748-9326/acbb91. Epub 2023 Feb 28.
4
A carbon-monitoring strategy through near-real-time data and space technology.一种通过近实时数据和空间技术的碳监测策略。
Innovation (Camb). 2022 Nov 3;4(1):100346. doi: 10.1016/j.xinn.2022.100346. eCollection 2023 Jan 30.
5
Role of space station instruments for improving tropical carbon flux estimates using atmospheric data.空间站仪器在利用大气数据改进热带碳通量估算方面的作用。
NPJ Microgravity. 2022 Nov 20;8(1):51. doi: 10.1038/s41526-022-00231-6.
The potential of a constellation of low earth orbit satellite imagers to monitor worldwide fossil fuel CO emissions from large cities and point sources.
一组低地球轨道卫星成像仪监测大城市和点源全球化石燃料二氧化碳排放的潜力。
Carbon Balance Manag. 2020 Sep 4;15(1):18. doi: 10.1186/s13021-020-00153-4.
4
High resolution temporal profiles in the Emissions Database for Global Atmospheric Research.全球大气研究排放数据库中的高时间分辨率时间剖面。
Sci Data. 2020 Apr 17;7(1):121. doi: 10.1038/s41597-020-0462-2.
5
The total carbon column observing network.大气总碳柱观测网络。
Philos Trans A Math Phys Eng Sci. 2011 May 28;369(1943):2087-112. doi: 10.1098/rsta.2010.0240.