Cooke William H, Grala Katarzyna, Wallis Robert C
Department of Geosciences/GeoResources Institute, Mississippi State University, MS, USA.
Int J Health Geogr. 2006 Aug 31;5:36. doi: 10.1186/1476-072X-5-36.
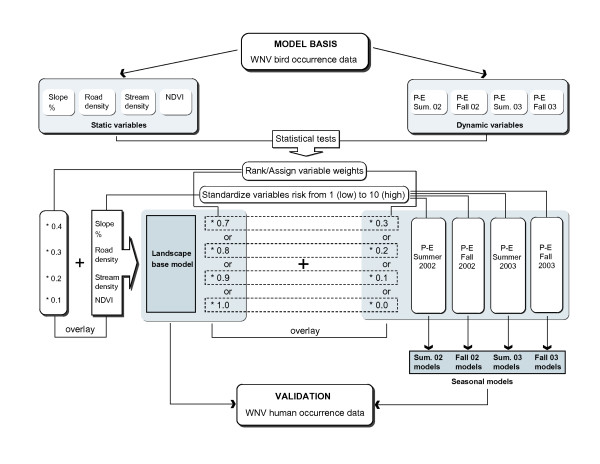
West Nile virus (WNV) poses a significant health risk for residents of Mississippi. Physicians and state health officials are interested in new and efficient methods for monitoring disease spread and predicting future outbreaks. Geographic Information Systems (GIS) models have the potential to support these efforts. Environmental conditions favorable for mosquito habitat were modeled using GIS to derive WNV risk maps for Mississippi. Variables important to WNV dissemination were selected and classified as static and dynamic. The static variables included road density, stream density, slope, and vegetation. The dynamic variable represented seasonal water budget and was calculated using precipitation and evaporation estimates. Significance tests provided deterministic evidence of variable importance to the models.
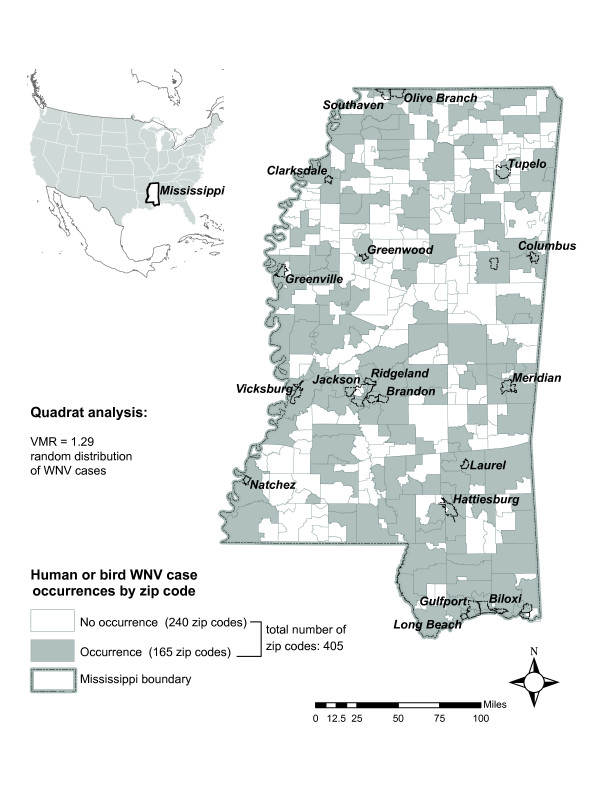
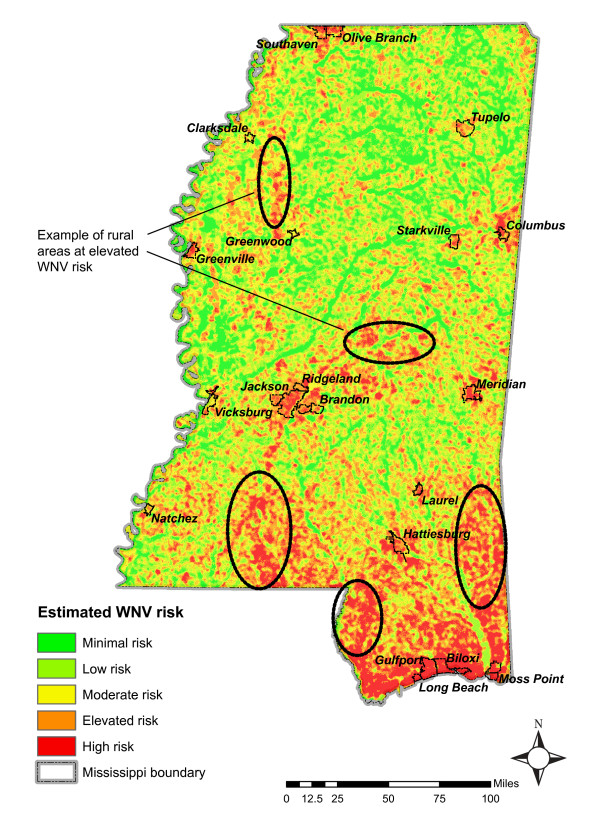
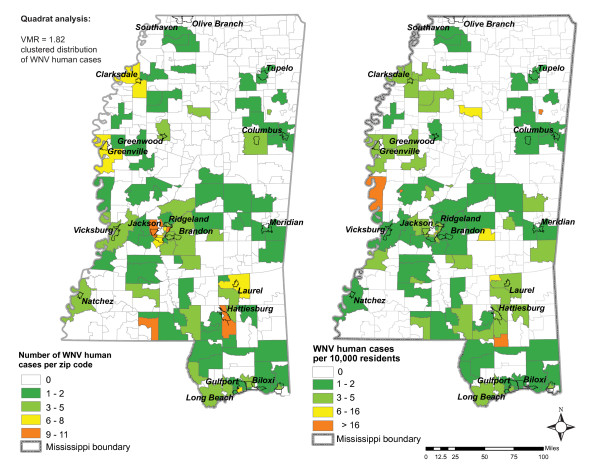
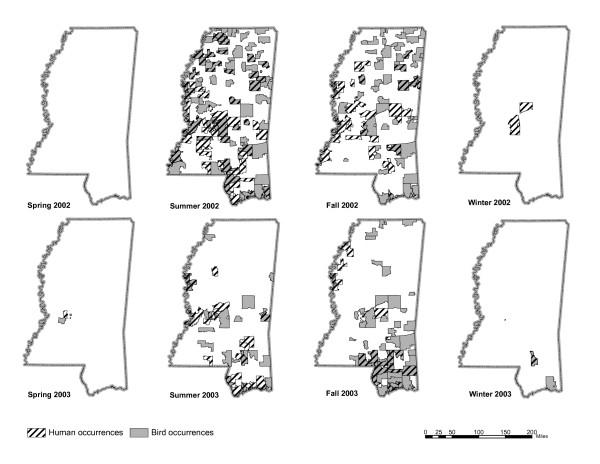
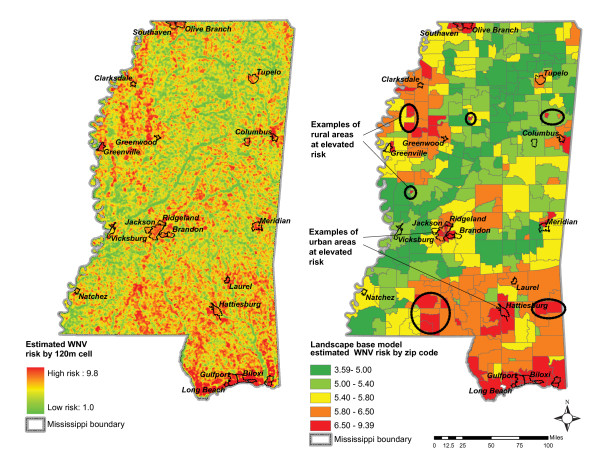
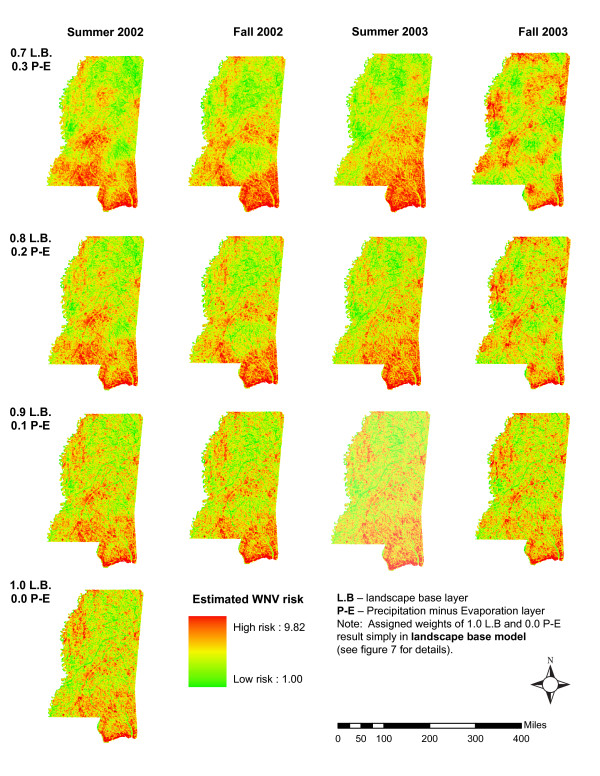
Several models were developed to estimate WNV risk including a landscape-base model and seasonal climatic sub-models. P-values from t-tests guided variable importance ranking. Variables were ranked and weights assigned as follows: road density (0.4), stream density (0.3), slope (0.2) and vegetation (0.1). This landscape-base model was modified by climatic conditions to assess the importance of climate to WNV risk. Human case data at the zip code level were used to validate modeling results. All models were summarized by zip codes for interpretation and model validation. For all models, estimated risk was higher for zip codes with at least one human case than for zip codes where no human cases were recorded. Overall median measure of risk by zip code indicated that 67% of human cases occurred in the high-risk category.
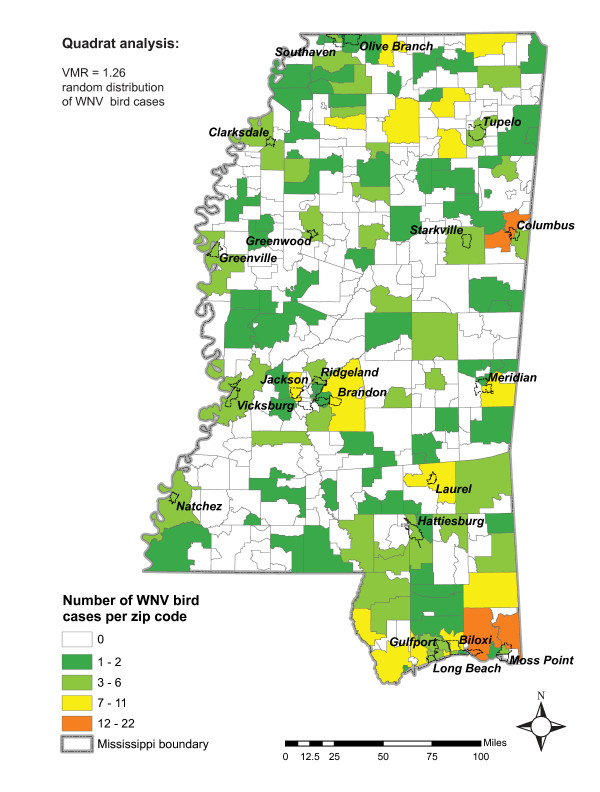
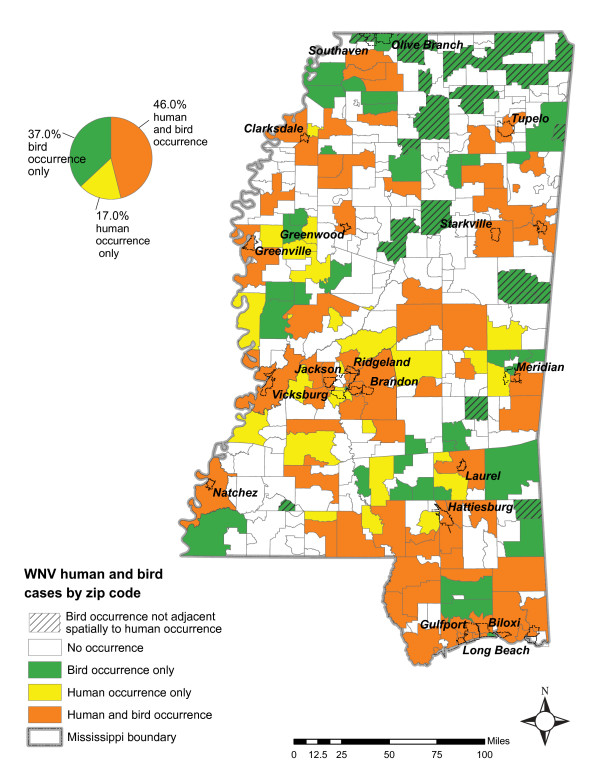
Modeling results indicated that dead bird occurrences are correlated with human WNV risk and can facilitate the assessment of environmental variables that contribute to that risk. Each variable's importance in GIS-based risk predictions was assigned deterministically. Our models indicated non-uniform distribution of risk across the state and showed elevated risk in urban and as well as rural areas. Model limitations include resolution of human data, zip code aggregation issues, and quality/availability of vegetation and stream density layers. Our approach verified that WNV risk can be modeled at the state level and can be modified for risk predictions of other vector-borne diseases in varied ecological regions.
西尼罗河病毒(WNV)对密西西比州居民的健康构成重大风险。医生和州卫生官员对监测疾病传播和预测未来疫情爆发的新的有效方法感兴趣。地理信息系统(GIS)模型有潜力支持这些工作。利用GIS对有利于蚊子栖息地的环境条件进行建模,以得出密西西比州的WNV风险地图。选择了对WNV传播重要的变量,并将其分为静态和动态变量。静态变量包括道路密度、溪流密度、坡度和植被。动态变量代表季节性水收支,通过降水量和蒸发量估算来计算。显著性检验提供了变量对模型重要性的确定性证据。
开发了几个模型来估计WNV风险,包括一个基于景观的模型和季节性气候子模型。t检验的P值指导变量重要性排序。变量排序并分配权重如下:道路密度(0.4)、溪流密度(0.3)、坡度(0.2)和植被(0.1)。这个基于景观的模型根据气候条件进行了修改,以评估气候对WNV风险的重要性。邮政编码级别的人类病例数据用于验证建模结果。所有模型按邮政编码汇总,以便进行解释和模型验证。对于所有模型,至少有一例人类病例的邮政编码区域的估计风险高于未记录人类病例的邮政编码区域。按邮政编码的总体风险中位数测量表明,67%的人类病例发生在高风险类别中。
建模结果表明,死鸟出现情况与人类WNV风险相关,并且可以促进对导致该风险的环境变量的评估。每个变量在基于GIS的风险预测中的重要性是确定性分配的。我们的模型表明该州风险分布不均匀,城市和农村地区风险均有所升高。模型的局限性包括人类数据的分辨率、邮政编码汇总问题以及植被和溪流密度层的质量/可用性。我们的方法验证了WNV风险可以在州一级进行建模,并且可以针对不同生态区域的其他媒介传播疾病的风险预测进行修改。