文献检索文档翻译深度研究
Suppr Zotero 插件Zotero 插件
邀请有礼套餐&价格历史记录

新学期,新优惠

限时优惠:9月1日-9月22日

30天高级会员仅需29元

1天体验卡首发特惠仅需5.99元

了解详情
不再提醒
插件&应用
Suppr Zotero 插件Zotero 插件浏览器插件Mac 客户端Windows 客户端微信小程序
高级版
套餐订阅购买积分包
AI 工具
文献检索文档翻译深度研究
关于我们
关于 Suppr公司介绍联系我们用户协议隐私条款
关注我们

Suppr 超能文献

核心技术专利:CN118964589B侵权必究
粤ICP备2023148730 号-1Suppr @ 2025

对SAM、SAM R包的全面评估以及一项旨在提高其性能的简单修改。

A comprehensive evaluation of SAM, the SAM R-package and a simple modification to improve its performance.

作者信息

Zhang Shunpu

机构信息

Department of Statistics, University of Nebraska Lincoln, Lincoln, NE 68583-0963, USA.

出版信息

BMC Bioinformatics. 2007 Jun 29;8:230. doi: 10.1186/1471-2105-8-230.


DOI:10.1186/1471-2105-8-230
PMID:17603887
原文链接:https://pmc.ncbi.nlm.nih.gov/articles/PMC1955751/
Abstract

BACKGROUND: The Significance Analysis of Microarrays (SAM) is a popular method for detecting significantly expressed genes and controlling the false discovery rate (FDR). Recently, it has been reported in the literature that the FDR is not well controlled by SAM. Due to the vast application of SAM in microarray data analysis, it is of great importance to have an extensive evaluation of SAM and its associated R-package (sam2.20). RESULTS: 
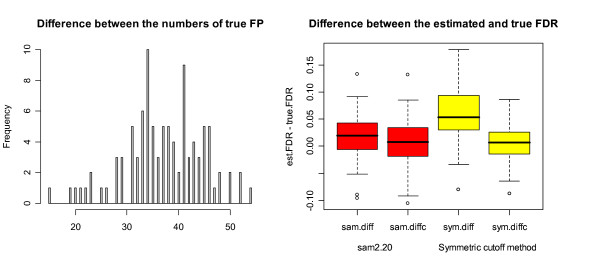
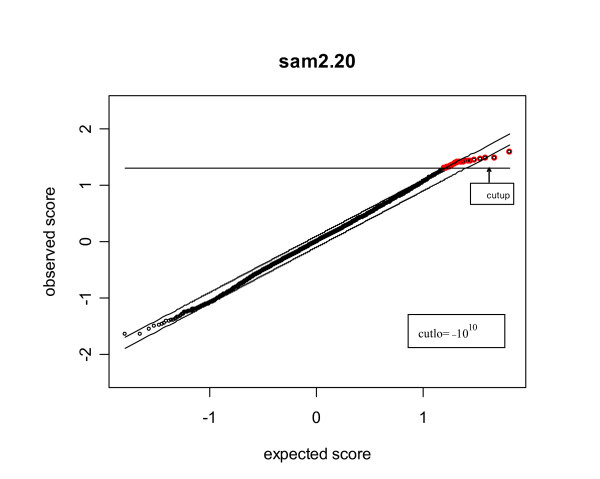
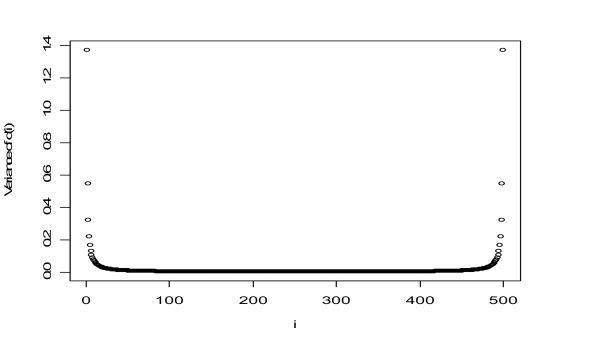
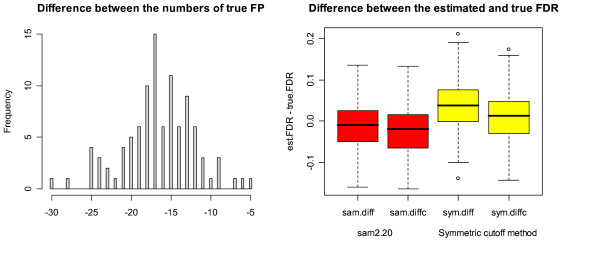
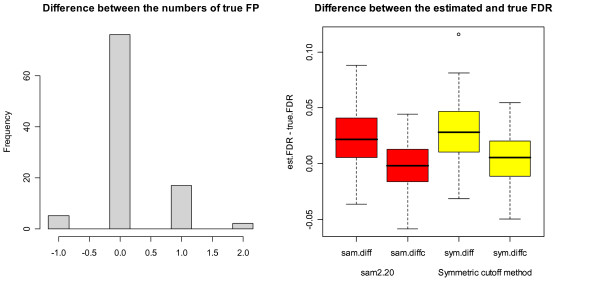
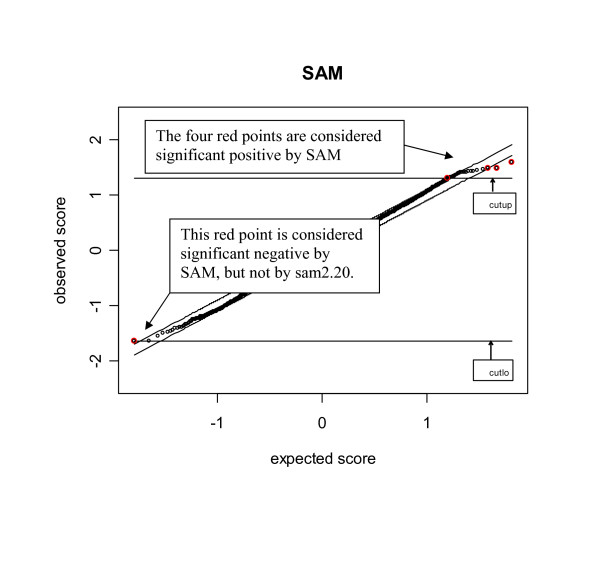
Our study has identified several discrepancies between SAM and sam2.20. One major difference is that SAM and sam2.20 use different methods for estimating FDR. Such discrepancies may cause confusion among the researchers who are using SAM or are developing the SAM-like methods. We have also shown that SAM provides no meaningful estimates of FDR and this problem has been corrected in sam2.20 by using a different formula for estimating FDR. However, we have found that, even with the improvement sam2.20 has made over SAM, sam2.20 may still produce erroneous and even conflicting results under certain situations. Using an example, we show that the problem of sam2.20 is caused by its use of asymmetric cutoffs which are due to the large variability of null scores at both ends of the order statistics. An obvious approach without the complication of the order statistics is the conventional symmetric cutoff method. For this reason, we have carried out extensive simulations to compare the performance of sam2.20 and the symmetric cutoff method. Finally, a simple modification is proposed to improve the FDR estimation of sam2.20 and the symmetric cutoff method. CONCLUSION: Our study shows that the most serious drawback of SAM is its poor estimation of FDR. Although this drawback has been corrected in sam2.20, the control of FDR by sam2.20 is still not satisfactory. The comparison between sam2.20 and the symmetric cutoff method reveals that the relative performance of sam2.20 to the symmetric cutff method depends on the ratio of induced to repressed genes in a microarray data, and is also affected by the ratio of DE to EE genes and the distributions of induced and repressed genes. Numerical simulations show that the symmetric cutoff method has the biggest advantage over sam2.20 when there are equal number of induced and repressed genes (i.e., the ratio of induced to repressed genes is 1). As the ratio of induced to repressed genes moves away from 1, the advantage of the symmetric cutoff method to sam2.20 is gradually diminishing until eventually sam2.20 becomes significantly better than the symmetric cutoff method when the differentially expressed (DE) genes are either all induced or all repressed genes. Simulation results also show that our proposed simple modification provides improved control of FDR for both sam2.20 and the symmetric cutoff method.

摘要

背景:微阵列显著性分析(SAM)是一种用于检测显著表达基因并控制错误发现率(FDR)的常用方法。最近,文献报道SAM对FDR的控制效果不佳。由于SAM在微阵列数据分析中的广泛应用,对SAM及其相关的R包(sam2.20)进行全面评估具有重要意义。 结果:我们的研究发现了SAM和sam2.20之间的几个差异。一个主要区别是SAM和sam2.20使用不同的方法来估计FDR。这种差异可能会给使用SAM或开发类似SAM方法的研究人员带来困惑。我们还表明,SAM无法提供有意义的FDR估计值,而sam2.20通过使用不同的公式来估计FDR纠正了这个问题。然而,我们发现,即使sam2.20在SAM的基础上有所改进,但在某些情况下,sam2.20仍可能产生错误甚至相互矛盾的结果。通过一个例子,我们表明sam2.20的问题是由于其使用不对称截断值导致的,这是由于顺序统计量两端的零分变化很大。一种没有顺序统计量复杂性的明显方法是传统的对称截断方法。因此,我们进行了广泛的模拟,以比较sam2.20和对称截断方法的性能。最后,提出了一个简单的修改方法来改进sam2.20和对称截断方法的FDR估计。 结论:我们的研究表明,SAM最严重的缺点是其对FDR的估计不佳。尽管这个缺点在sam2.20中得到了纠正,但sam2.20对FDR的控制仍然不令人满意。sam2.20与对称截断方法的比较表明,sam2.20相对于对称截断方法的相对性能取决于微阵列数据中诱导基因与抑制基因的比例,并且还受到差异表达(DE)基因与等效表达(EE)基因的比例以及诱导基因和抑制基因分布的影响。数值模拟表明,当诱导基因和抑制基因数量相等(即诱导基因与抑制基因的比例为1)时,对称截断方法相对于sam2.20具有最大优势。随着诱导基因与抑制基因的比例偏离1,对称截断方法相对于sam2.20的优势逐渐减小,直到最终当差异表达(DE)基因全部为诱导基因或全部为抑制基因时,sam2.20明显优于对称截断方法。模拟结果还表明,我们提出的简单修改方法为sam2.20和对称截断方法都提供了更好的FDR控制。

https://cdn.ncbi.nlm.nih.gov/pmc/blobs/dc6d/1955751/f6c2319b7fc7/1471-2105-8-230-6.jpg
https://cdn.ncbi.nlm.nih.gov/pmc/blobs/dc6d/1955751/242121982efc/1471-2105-8-230-1.jpg
https://cdn.ncbi.nlm.nih.gov/pmc/blobs/dc6d/1955751/9a486ae759c5/1471-2105-8-230-2.jpg
https://cdn.ncbi.nlm.nih.gov/pmc/blobs/dc6d/1955751/2b3bc3a4f46a/1471-2105-8-230-3.jpg
https://cdn.ncbi.nlm.nih.gov/pmc/blobs/dc6d/1955751/ce45d0b8368d/1471-2105-8-230-5.jpg
https://cdn.ncbi.nlm.nih.gov/pmc/blobs/dc6d/1955751/a6e949447260/1471-2105-8-230-4.jpg
https://cdn.ncbi.nlm.nih.gov/pmc/blobs/dc6d/1955751/f6c2319b7fc7/1471-2105-8-230-6.jpg

相似文献

[1]
A comprehensive evaluation of SAM, the SAM R-package and a simple modification to improve its performance.

BMC Bioinformatics. 2007-6-29

[2]
A note on using permutation-based false discovery rate estimates to compare different analysis methods for microarray data.

Bioinformatics. 2005-12-1

[3]
False discovery rate, sensitivity and sample size for microarray studies.

Bioinformatics. 2005-7-1

[4]
On correcting the overestimation of the permutation-based false discovery rate estimator.

Bioinformatics. 2008-8-1

[5]
Re-sampling strategy to improve the estimation of number of null hypotheses in FDR control under strong correlation structures.

BMC Bioinformatics. 2007-5-18

[6]
A unified framework for finding differentially expressed genes from microarray experiments.

BMC Bioinformatics. 2007-9-18

[7]
Multidimensional local false discovery rate for microarray studies.

Bioinformatics. 2006-3-1

[8]
A mixture model for estimating the local false discovery rate in DNA microarray analysis.

Bioinformatics. 2004-11-1

[9]
Effects of dependence in high-dimensional multiple testing problems.

BMC Bioinformatics. 2008-2-25

[10]
Significance analysis of microarray for relative quantitation of LC/MS data in proteomics.

BMC Bioinformatics. 2008-4-10

引用本文的文献

[1]
Comparative Untargeted Metabolomic Profiling of Induced Mitochondrial Fusion in Pancreatic Cancer.

Metabolites. 2021-9-15

[2]
Lack of Atorvastatin Effect on Monocyte Gene Expression and Inflammatory Markers in HIV-1-infected ART-suppressed Individuals at Risk of non-AIDS Comorbidities.

Pathog Immun. 2021-8-13

[3]
Evidence for Persistent Monocyte and Immune Dysregulation After Prolonged Viral Suppression Despite Normalization of Monocyte Subsets, sCD14 and sCD163 in HIV-Infected Individuals.

Pathog Immun. 2019-12-17

[4]
Natural human genetic variation determines basal and inducible expression of , an obesity-associated gene.

Proc Natl Acad Sci U S A. 2019-10-28

[5]
Identification of monocyte-like precursors of granulocytes in cancer as a mechanism for accumulation of PMN-MDSCs.

J Exp Med. 2019-6-25

[6]
Robust gene selection methods using weighting schemes for microarray data analysis.

BMC Bioinformatics. 2017-9-2

[7]
Lectin-type oxidized LDL receptor-1 distinguishes population of human polymorphonuclear myeloid-derived suppressor cells in cancer patients.

Sci Immunol. 2016-8

[8]
Identify potential drugs for cardiovascular diseases caused by stress-induced genes in vascular smooth muscle cells.

PeerJ. 2016-9-28

[9]
Thermodynamically optimal whole-genome tiling microarray design and validation.

BMC Res Notes. 2016-6-13

[10]
Feature genes predicting the FLT3/ITD mutation in acute myeloid leukemia.

Mol Med Rep. 2016-7

本文引用的文献

[1]
An improved nonparametric approach for detecting differentially expressed genes with replicated microarray data.

Stat Appl Genet Mol Biol. 2006

[2]
Linear models and empirical bayes methods for assessing differential expression in microarray experiments.

Stat Appl Genet Mol Biol. 2004

[3]
A note on using permutation-based false discovery rate estimates to compare different analysis methods for microarray data.

Bioinformatics. 2005-12-1

[4]
Using weighted permutation scores to detect differential gene expression with microarray data.

J Bioinform Comput Biol. 2005-8

[5]
Considerations when using the significance analysis of microarrays (SAM) algorithm.

BMC Bioinformatics. 2005-5-29

[6]
VarMixt: efficient variance modelling for the differential analysis of replicated gene expression data.

Bioinformatics. 2005-2-15

[7]
Detecting differential gene expression with a semiparametric hierarchical mixture method.

Biostatistics. 2004-4

[8]
On parametric empirical Bayes methods for comparing multiple groups using replicated gene expression profiles.

Stat Med. 2003-12-30

[9]
Statistical significance for genomewide studies.

Proc Natl Acad Sci U S A. 2003-8-5

[10]
On the use of permutation in and the performance of a class of nonparametric methods to detect differential gene expression.

Bioinformatics. 2003-7-22

文献AI研究员

20分钟写一篇综述,助力文献阅读效率提升50倍

立即体验

用中文搜PubMed

大模型驱动的PubMed中文搜索引擎

马上搜索

推荐工具

医学文档翻译智能文献检索