Animal Breeding & Genomics Centre, Wageningen University, Wageningen, The Netherlands.
BMC Genet. 2009 Dec 20;10:86. doi: 10.1186/1471-2156-10-86.
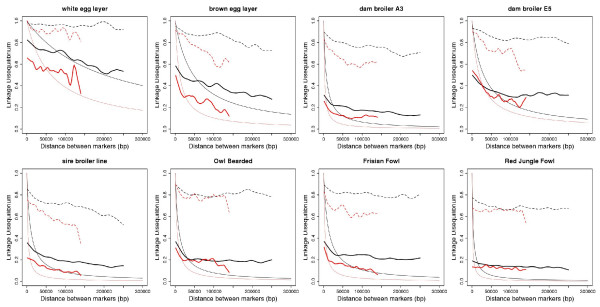
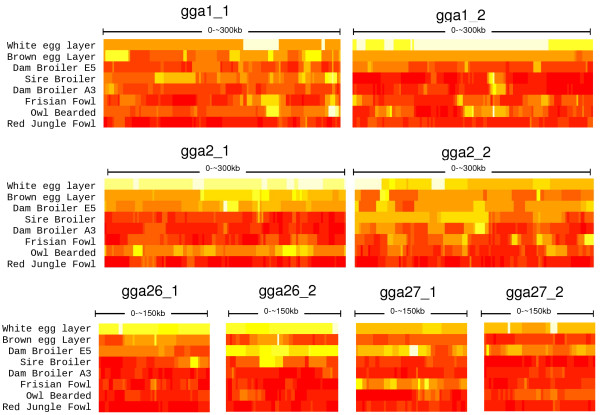
The chicken (Gallus gallus), like most avian species, has a very distinct karyotype consisting of many micro- and a few macrochromosomes. While it is known that recombination frequencies are much higher for micro- as compared to macrochromosomes, there is limited information on differences in linkage disequilibrium (LD) and haplotype diversity between these two classes of chromosomes. In this study, LD and haplotype diversity were systematically characterized in 371 birds from eight chicken populations (commercial lines, fancy breeds, and red jungle fowl) across macro- and microchromosomes. To this end we sampled four regions of approximately 1 cM each on macrochromosomes (GGA1 and GGA2), and four 1.5 -2 cM regions on microchromosomes (GGA26 and GGA27) at a high density of 1 SNP every 2 kb (total of 889 SNPs).
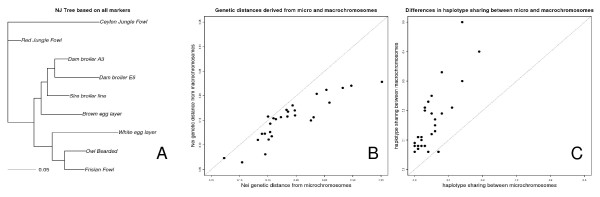
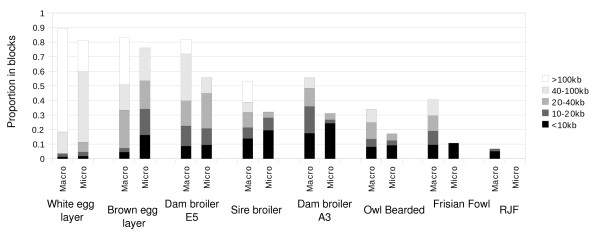
At a similar physical distance, LD, haplotype homozygosity, haploblock structure, and haplotype sharing were all lower for the micro- as compared to the macrochromosomes. These differences were consistent across populations. Heterozygosity, genetic differentiation, and derived allele frequencies were also higher for the microchromosomes. Differences in LD, haplotype variation, and haplotype sharing between populations were largely in line with known demographic history of the commercial chicken. Despite very low levels of LD, as measured by r2 for most populations, some haploblock structure was observed, particularly in the macrochromosomes, but the haploblock sizes were typically less than 10 kb.
Differences in LD between micro- and macrochromosomes were almost completely explained by differences in recombination rate. Differences in haplotype diversity and haplotype sharing between micro- and macrochromosomes were explained by differences in recombination rate and genotype variation. Haploblock structure was consistent with demography of the chicken populations, and differences in recombination rates between micro- and macrochromosomes. The limited haploblock structure and LD suggests that future whole-genome marker assays will need 100+K SNPs to exploit haplotype information. Interpretation and transferability of genetic parameters will need to take into account the size of chromosomes in chicken, and, since most birds have microchromosomes, in other avian species as well.
鸡(Gallus gallus)与大多数鸟类物种一样,具有由许多微染色体和少数大染色体组成的非常独特的染色体组型。虽然已知重组频率在微染色体上比在大染色体上高得多,但关于这两类染色体之间的连锁不平衡(LD)和单倍型多样性的差异信息有限。在这项研究中,我们在来自 8 个鸡种群(商业品系、观赏品种和红原鸡)的 371 只鸟类中系统地研究了大、微染色体上的 LD 和单倍型多样性。为此,我们在大染色体(GGA1 和 GGA2)上每 1cM 采样约 4 个区域,每个区域约 1cM,在微染色体(GGA26 和 GGA27)上每 1.5-2cM 采样 4 个区域,每个区域 SNP 密度为 1 个 SNP/2kb(共 889 个 SNP)。
在相似的物理距离上,微染色体的 LD、单倍型纯合度、单倍型块结构和单倍型共享均低于大染色体。这些差异在不同种群中是一致的。微染色体的杂合度、遗传分化和衍生等位基因频率也更高。种群间的 LD、单倍型变异和单倍型共享差异与商业鸡的已知人口历史基本一致。尽管大多数种群的 r2 测量的 LD 水平非常低,但观察到了一些单倍型块结构,尤其是在大染色体上,但单倍型块的大小通常小于 10kb。
微染色体和大染色体之间的 LD 差异几乎完全可以用重组率的差异来解释。微染色体和大染色体之间的单倍型多样性和单倍型共享差异可以用重组率和基因型变异来解释。单倍型块结构与鸡种群的人口统计学一致,微染色体和大染色体之间的重组率差异。有限的单倍型块结构和 LD 表明,未来的全基因组标记检测将需要 100 多个 SNP 来利用单倍型信息。在鸡中,以及在大多数鸟类中,由于大多数鸟类都有微染色体,遗传参数的解释和可转移性都需要考虑染色体的大小。