• 文献检索
  • 文档翻译
  • 深度研究
  • 学术资讯
  • Suppr Zotero 插件Zotero 插件
  • 邀请有礼
  • 套餐&价格
  • 历史记录
应用&插件
Suppr Zotero 插件Zotero 插件浏览器插件Mac 客户端Windows 客户端微信小程序
定价
高级版会员购买积分包购买API积分包
服务
文献检索文档翻译深度研究API 文档MCP 服务
关于我们
关于 Suppr公司介绍联系我们用户协议隐私条款
关注我们

Suppr 超能文献

核心技术专利:CN118964589B侵权必究
粤ICP备2023148730 号-1Suppr @ 2026

文献检索

告别复杂PubMed语法,用中文像聊天一样搜索,搜遍4000万医学文献。AI智能推荐,让科研检索更轻松。

立即免费搜索

文件翻译

保留排版,准确专业,支持PDF/Word/PPT等文件格式,支持 12+语言互译。

免费翻译文档

深度研究

AI帮你快速写综述,25分钟生成高质量综述,智能提取关键信息,辅助科研写作。

立即免费体验

西班牙南部小地区死亡率的时空趋势。

Spatio-temporal trends of mortality in small areas of Southern Spain.

机构信息

Escuela Andaluza de Salud Pública, Granada, Spain.

出版信息

BMC Public Health. 2010 Jan 20;10:26. doi: 10.1186/1471-2458-10-26.

DOI:10.1186/1471-2458-10-26
PMID:20089142
原文链接:https://pmc.ncbi.nlm.nih.gov/articles/PMC2881099/
Abstract

BACKGROUND

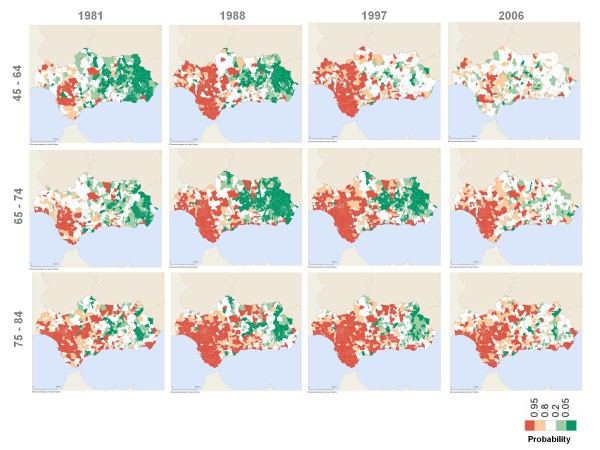
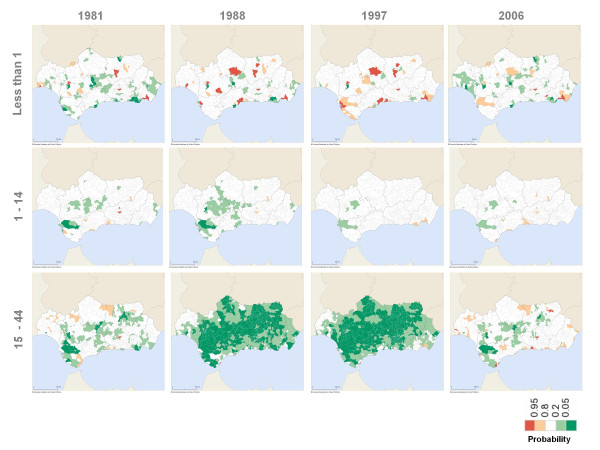
Most mortality atlases show static maps from count data aggregated over time. This procedure has several methodological problems and serious limitations for decision making in Public Health. The evaluation of health outcomes, including mortality, should be approached from a dynamic time perspective that is specific for each gender and age group. At the moment, researches in Spain do not provide a dynamic image of the population's mortality status from a spatio-temporal point of view. The aim of this paper is to describe the spatial distribution of mortality from all causes in small areas of Andalusia (Southern Spain) and evolution over time from 1981 to 2006.

METHODS

A small-area ecological study was devised using the municipality as the unit for analysis. Two spatio-temporal hierarchical Bayesian models were estimated for each age group and gender. One of these was used to estimate the specific mortality rate, together with its time trends, and the other to estimate the specific rate ratio for each municipality compared with Spain as a whole.

RESULTS

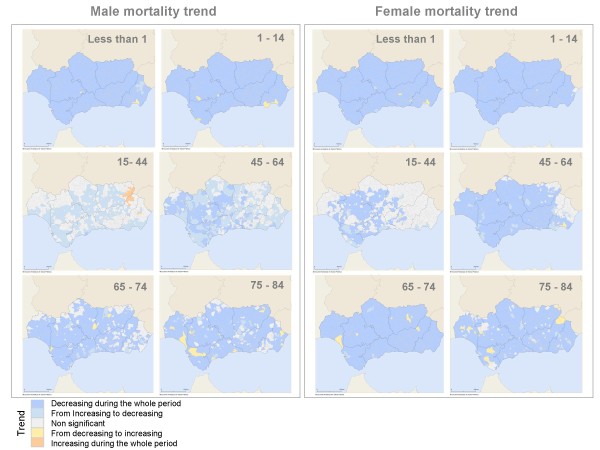
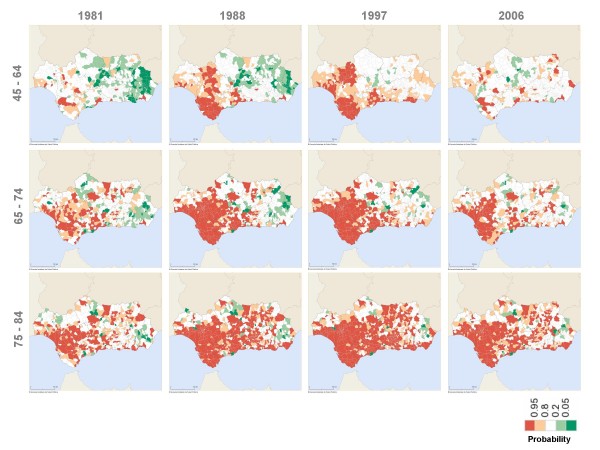
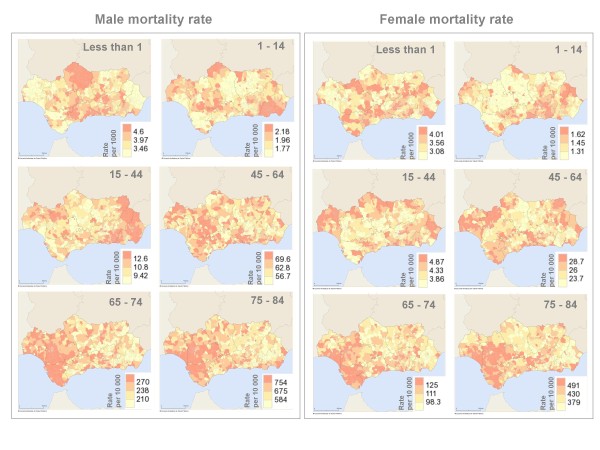
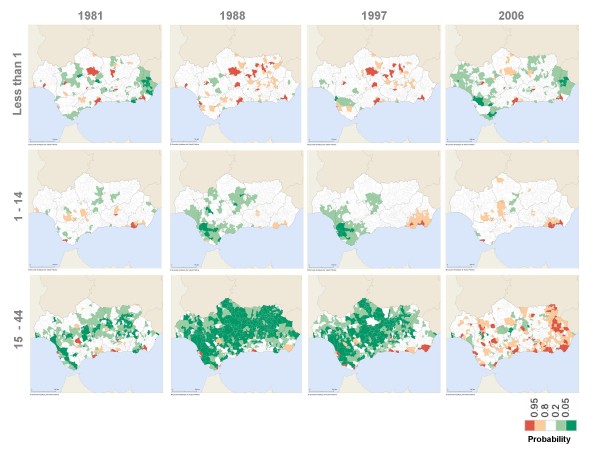
More than 97% of the municipalities showed a diminishing or flat mortality trend in all gender and age groups. In 2006, over 95% of municipalities showed male and female mortality specific rates similar or significantly lower than Spanish rates for all age groups below 65. Systematically, municipalities in Western Andalusia showed significant male and female mortality excess from 1981 to 2006 only in age groups over 65.

CONCLUSIONS

The study shows a dynamic geographical distribution of mortality, with a different pattern for each year, gender and age group. This information will contribute towards a reflection on the past, present and future of mortality in Andalusia.

摘要

背景

大多数死亡率地图集显示的是时间上聚合的计数数据的静态地图。这种方法存在几个方法学问题,并且对公共卫生决策有严重的限制。健康结果的评估,包括死亡率,应该从特定于每个性别和年龄组的动态时间角度来考虑。目前,西班牙的研究没有从时空角度提供人口死亡率状况的动态图像。本文的目的是描述 1981 年至 2006 年期间安达卢西亚(西班牙南部)小地区所有原因死亡率的空间分布和随时间的演变。

方法

采用以市为分析单位的小区域生态研究设计。为每个年龄组和性别估计了两个时空层次贝叶斯模型。其中之一用于估计特定死亡率及其时间趋势,另一个用于估计每个市与西班牙整体相比的特定比率。

结果

超过 97%的市在所有性别和年龄组中显示出死亡率下降或持平的趋势。在 2006 年,超过 95%的市的男性和女性死亡率特定率与所有 65 岁以下年龄组的西班牙比率相似或明显较低。系统地说,1981 年至 2006 年期间,安达卢西亚西部的市只有在 65 岁以上的年龄组中显示出男性和女性死亡率明显偏高的情况。

结论

该研究显示了死亡率的动态地理分布,每年、每个性别和年龄组的模式都不同。这些信息将有助于对安达卢西亚过去、现在和未来的死亡率进行反思。

https://cdn.ncbi.nlm.nih.gov/pmc/blobs/82dd/2881099/1061ee6ca6f6/1471-2458-10-26-6.jpg
https://cdn.ncbi.nlm.nih.gov/pmc/blobs/82dd/2881099/cdc7a4eb9c33/1471-2458-10-26-1.jpg
https://cdn.ncbi.nlm.nih.gov/pmc/blobs/82dd/2881099/7e29dc41a990/1471-2458-10-26-2.jpg
https://cdn.ncbi.nlm.nih.gov/pmc/blobs/82dd/2881099/47e74d75a4df/1471-2458-10-26-3.jpg
https://cdn.ncbi.nlm.nih.gov/pmc/blobs/82dd/2881099/43a70c24ff46/1471-2458-10-26-5.jpg
https://cdn.ncbi.nlm.nih.gov/pmc/blobs/82dd/2881099/26f2bd4090ff/1471-2458-10-26-4.jpg
https://cdn.ncbi.nlm.nih.gov/pmc/blobs/82dd/2881099/1061ee6ca6f6/1471-2458-10-26-6.jpg

相似文献

1
Spatio-temporal trends of mortality in small areas of Southern Spain.西班牙南部小地区死亡率的时空趋势。
BMC Public Health. 2010 Jan 20;10:26. doi: 10.1186/1471-2458-10-26.
2
Geographical and Temporal Variations in Female Breast Cancer Mortality in the Municipalities of Andalusia (Southern Spain).安达卢西亚自治区(西班牙南部)各市女性乳腺癌死亡率的地理和时间变化
Int J Environ Res Public Health. 2016 Nov 22;13(11):1162. doi: 10.3390/ijerph13111162.
3
[Interactive mortality atlas in Andalusia, Spain (AIMA)].[西班牙安达卢西亚交互式死亡率地图集(AIMA)]
Rev Esp Salud Publica. 2008 Jul-Aug;82(4):379-94. doi: 10.1590/s1135-57272008000400003.
4
Trends in socioeconomic inequalities in mortality in small areas of 33 Spanish cities.西班牙33个城市小区域死亡率的社会经济不平等趋势。
BMC Public Health. 2016 Jul 29;16:663. doi: 10.1186/s12889-016-3190-y.
5
[State of health of populations residing in geothermal areas of Tuscany].[托斯卡纳地热区居民的健康状况]
Epidemiol Prev. 2012 Sep-Oct;36(5 Suppl 1):1-104.
6
Smoothed Temporal Atlases of Age-Gender All-Cause Mortality in South Africa.南非年龄-性别全因死亡率的平滑时间图谱。
Int J Environ Res Public Health. 2017 Sep 15;14(9):1072. doi: 10.3390/ijerph14091072.
7
Analysis of age-period-cohort effects on overall mortality in Andalusia (Southern Spain).安达卢西亚(西班牙南部)全因死亡率的年龄-时期-队列效应分析。
Public Health. 2013 Oct;127(10):922-9. doi: 10.1016/j.puhe.2013.04.032. Epub 2013 Sep 24.
8
[Avoidable and nonavoidable mortality: geographical distribution in small areas in Spain (1990-2001)].[可避免和不可避免的死亡率:西班牙小区域的地理分布(1990 - 2001年)]
Gac Sanit. 2009 Jan-Feb;23(1):16-22. doi: 10.1016/j.gaceta.2007.10.002. Epub 2009 Jan 9.
9
[Inequalities in mortality between Andalusia and Spain from 1990 to 2010].1990年至2010年安达卢西亚与西班牙之间的死亡率不平等情况
Gac Sanit. 2013 Jul-Aug;27(4):298-303. doi: 10.1016/j.gaceta.2012.12.006. Epub 2013 Feb 22.
10
Examining geographic patterns of mortality: the atlas of mortality in small areas in Spain (1987-1995).审视死亡率的地理分布模式:西班牙小区域死亡率地图集(1987 - 1995年)
Eur J Public Health. 2003 Jun;13(2):115-23. doi: 10.1093/eurpub/13.2.115.

引用本文的文献

1
Cancer mortality distribution in South Africa, 1997-2016.1997 - 2016年南非癌症死亡率分布情况
Front Epidemiol. 2023 Jun 19;3:1094271. doi: 10.3389/fepid.2023.1094271. eCollection 2023.
2
Spatio-temporal evolution of mortality in Cape Verde: 1995-2018.佛得角1995 - 2018年死亡率的时空演变
PLOS Glob Public Health. 2023 Mar 10;3(3):e0000753. doi: 10.1371/journal.pgph.0000753. eCollection 2023.
3
Mapping subnational HIV mortality in six Latin American countries with incomplete vital registration systems.在六个生命登记系统不完整的拉丁美洲国家绘制国家以下层面的艾滋病毒死亡率地图。

本文引用的文献

1
Uncontrolled migrations as a cause of inequality in health and mortality in small-area studies.在小区域研究中,不受控制的人口迁移作为健康和死亡率不平等的一个原因。
Epidemiology. 2009 May;20(3):411-8. doi: 10.1097/EDE.0b013e318196aaf4.
2
[Interactive mortality atlas in Andalusia, Spain (AIMA)].[西班牙安达卢西亚交互式死亡率地图集(AIMA)]
Rev Esp Salud Publica. 2008 Jul-Aug;82(4):379-94. doi: 10.1590/s1135-57272008000400003.
3
Health inequalities among the elderly in western Europe.西欧老年人的健康不平等问题。
BMC Med. 2021 Jan 8;19(1):4. doi: 10.1186/s12916-020-01876-4.
4
Bayesian Estimation of Age-Specific Mortality and Life Expectancy for Small Areas With Defective Vital Records.小区域有缺陷生命记录的年龄别死亡率和预期寿命的贝叶斯估计。
Demography. 2018 Aug;55(4):1363-1388. doi: 10.1007/s13524-018-0695-2.
5
Smoothed Temporal Atlases of Age-Gender All-Cause Mortality in South Africa.南非年龄-性别全因死亡率的平滑时间图谱。
Int J Environ Res Public Health. 2017 Sep 15;14(9):1072. doi: 10.3390/ijerph14091072.
6
Geographical and Temporal Variations in Female Breast Cancer Mortality in the Municipalities of Andalusia (Southern Spain).安达卢西亚自治区(西班牙南部)各市女性乳腺癌死亡率的地理和时间变化
Int J Environ Res Public Health. 2016 Nov 22;13(11):1162. doi: 10.3390/ijerph13111162.
7
Age-period-cohort effect on female breast cancer mortality in Southern Spain.西班牙南部女性乳腺癌死亡率的年龄-时期-队列效应。
Med Oncol. 2013;30(3):671. doi: 10.1007/s12032-013-0671-z. Epub 2013 Jul 25.
8
Health status convergence at the local level: empirical evidence from Austria.健康状况在地方层面的趋同:来自奥地利的经验证据。
Int J Equity Health. 2011 Aug 24;10:34. doi: 10.1186/1475-9276-10-34.
J Epidemiol Community Health. 2008 Jun;62(6):492-8. doi: 10.1136/jech.2006.059279.
4
[Ten statements on the future of public health in Europe].
Gac Sanit. 2007 Jul-Aug;21(4):349-54. doi: 10.1157/13108511.
5
The misuse of count data aggregated over time for disease mapping.在疾病地图绘制中对随时间汇总的计数数据的误用。
Stat Med. 2007 Oct 30;26(24):4489-504. doi: 10.1002/sim.2861.
6
Health-exposure modeling and the ecological fallacy.健康暴露建模与生态谬误。
Biostatistics. 2006 Jul;7(3):438-55. doi: 10.1093/biostatistics/kxj017. Epub 2006 Jan 20.
7
Impact of intercensal population projections and error of closure on breast cancer surveillance: examples from 10 California counties.两次人口普查期间人口预测及封闭误差对乳腺癌监测的影响:来自加利福尼亚州10个县的实例
Breast Cancer Res. 2005;7(5):R655-60. doi: 10.1186/bcr1266. Epub 2005 Jun 7.
8
Health inequalities and social dynamics in Europe.
BMJ. 2005 Jul 23;331(7510):186-7. doi: 10.1136/bmj.331.7510.186.
9
A comparison of Bayesian spatial models for disease mapping.用于疾病地图绘制的贝叶斯空间模型比较。
Stat Methods Med Res. 2005 Feb;14(1):35-59. doi: 10.1191/0962280205sm388oa.
10
Interpreting posterior relative risk estimates in disease-mapping studies.疾病地图绘制研究中后验相对风险估计值的解读
Environ Health Perspect. 2004 Jun;112(9):1016-25. doi: 10.1289/ehp.6740.