Berrocal Veronica J, Gelfand Alan E, Holland David M
Department of Statistical Science, Duke University, Durham, NC 27708, USA.
J Agric Biol Environ Stat. 2010 Jun 1;15(2):176-197. doi: 10.1007/s13253-009-0004-z.
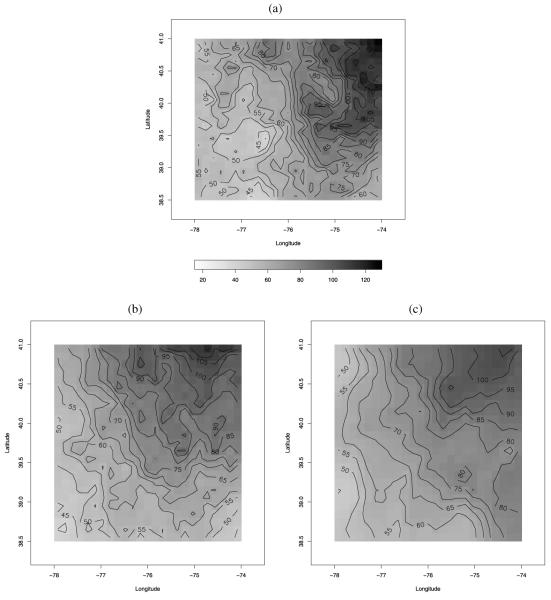
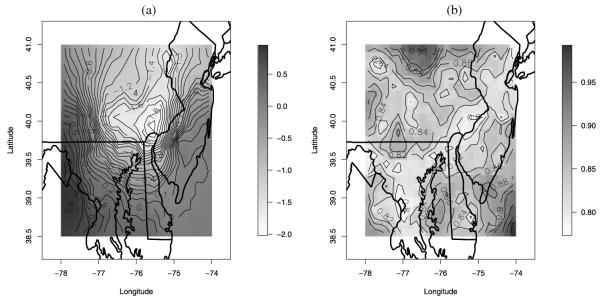
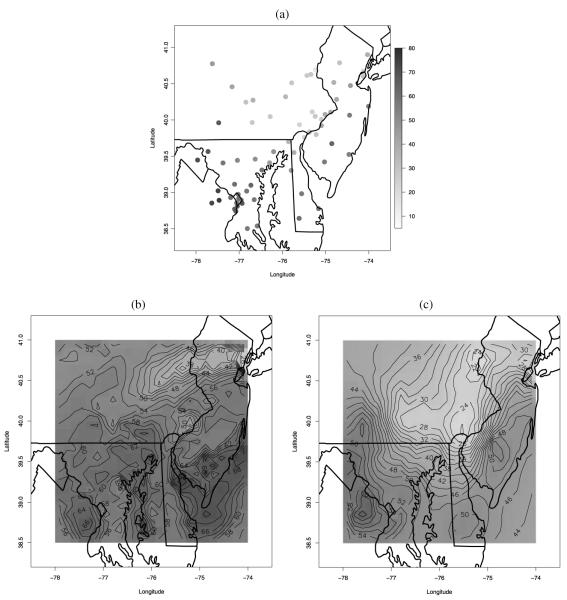
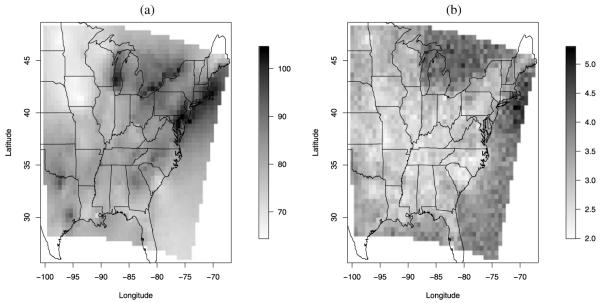
Often, in environmental data collection, data arise from two sources: numerical models and monitoring networks. The first source provides predictions at the level of grid cells, while the second source gives measurements at points. The first is characterized by full spatial coverage of the region of interest, high temporal resolution, no missing data but consequential calibration concerns. The second tends to be sparsely collected in space with coarser temporal resolution, often with missing data but, where recorded, provides, essentially, the true value. Accommodating the spatial misalignment between the two types of data is of fundamental importance for both improved predictions of exposure as well as for evaluation and calibration of the numerical model. In this article we propose a simple, fully model-based strategy to downscale the output from numerical models to point level. The static spatial model, specified within a Bayesian framework, regresses the observed data on the numerical model output using spatially-varying coefficients which are specified through a correlated spatial Gaussian process.As an example, we apply our method to ozone concentration data for the eastern U.S. and compare it to Bayesian melding (Fuentes and Raftery 2005) and ordinary kriging (Cressie 1993; Chilès and Delfiner 1999). Our results show that our method outperforms Bayesian melding in terms of computing speed and it is superior to both Bayesian melding and ordinary kriging in terms of predictive performance; predictions obtained with our method are better calibrated and predictive intervals have empirical coverage closer to the nominal values. Moreover, our model can be easily extended to accommodate for the temporal dimension. In this regard, we consider several spatio-temporal versions of the static model. We compare them using out-of-sample predictions of ozone concentration for the eastern U.S. for the period May 1-October 15, 2001. For the best choice, we present a summary of the analysis. Supplemental material, including color versions of Figures 4, 5, 6, 7, and 8, and MCMC diagnostic plots, are available online.
通常,在环境数据收集过程中,数据来源于两个方面:数值模型和监测网络。第一个来源在网格单元层面提供预测结果,而第二个来源则给出点上的测量值。第一个来源的特点是对感兴趣区域具有全面的空间覆盖、高时间分辨率、无缺失数据,但存在校准问题。第二个来源往往在空间上收集较为稀疏,时间分辨率较粗,经常有缺失数据,但在有记录的地方,基本上提供真实值。解决这两类数据之间的空间错位对于改进暴露预测以及数值模型的评估和校准都至关重要。在本文中,我们提出了一种简单的、完全基于模型的策略,将数值模型的输出降尺度到点层面。在贝叶斯框架内指定的静态空间模型,使用通过相关空间高斯过程指定的空间变化系数,对数值模型输出上的观测数据进行回归。作为一个例子,我们将我们的方法应用于美国东部的臭氧浓度数据,并将其与贝叶斯融合(富恩特斯和拉夫蒂,2005年)以及普通克里金法(克雷斯,1993年;希莱斯和德尔菲纳,1999年)进行比较。我们的结果表明,我们的方法在计算速度方面优于贝叶斯融合,并且在预测性能方面优于贝叶斯融合和普通克里金法;用我们的方法获得的预测结果校准得更好,预测区间的经验覆盖率更接近标称值。此外,我们的模型可以很容易地扩展以适应时间维度。在这方面,我们考虑了静态模型的几种时空版本。我们使用2001年5月1日至10月15日期间美国东部臭氧浓度的样本外预测对它们进行比较。对于最佳选择,我们给出了分析总结。补充材料,包括图4、5、6、7和8的彩色版本以及MCMC诊断图,可在线获取。