Department of Epidemiology and Public Health & HRB Centre for Health and Diet Research, University College Cork, Ireland.
BMC Public Health. 2011 May 18;11:331. doi: 10.1186/1471-2458-11-331.
Cultural pressures to be thin and tall are postulated to cause people to misreport their body weight and height towards more socially normative (i.e., desirable) values, but a paucity of direct evidence supports this idea. We developed a novel non-linear approach to examining weight, height, and BMI misreporting biases and used this approach to examine the association between socially non-normative weight and misreporting biases in adults.
The Survey of Lifestyles, Attitudes, and Nutrition 2007 (SLÁN 2007), a nationally representative survey of the Republic of Ireland (N = 1942 analyzed) was used. Self-reported weight (height) was classified as under-reported by ≥ 2.0 kg (2.0 cm), over-reported by ≥ 2.0 kg (2.0 cm), or accurately reported within 2.0 kg (2.0 cm) to account for technical errors of measurement and short-term fluctuations in measured weight (height). A simulation strategy was used to define self-report-based BMI as under-estimated by more than 1.40 kg/m2, over-estimated by more than 1.40 kg/m2, or accurately estimated within 1.40 kg/m2. Patterns of biases in self-reported weight, height, and BMI were explored. Logistic regression was used to identify factors associated with mis-estimated BMI and to calculate adjusted odds ratios (AOR) and 99% confidence intervals (99%CI).
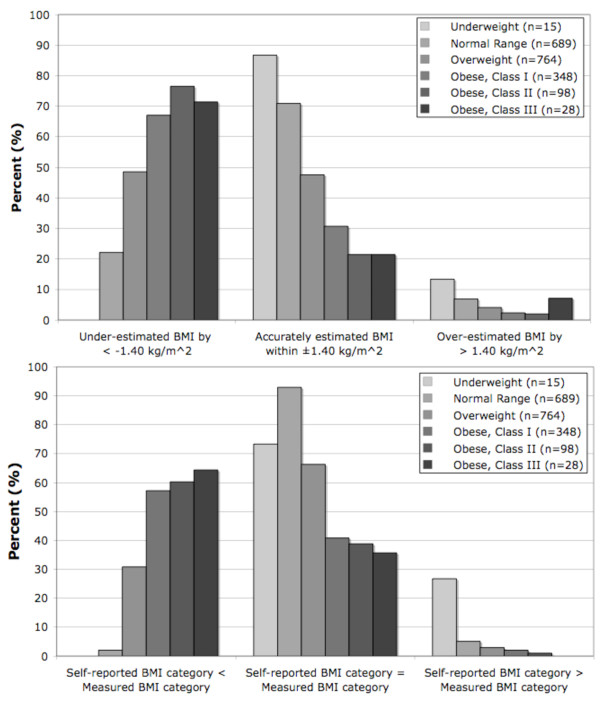
The patterns of bias contributing the most to BMI mis-estimation were consistently, in decreasing order of influence, (1) under-reported weight combined with over-reported height, (2) under-reported weight with accurately reported height, and (3) accurately reported weight with over-reported height. Average bias in self-report-based BMI was -1.34 kg/m2 overall and -0.49, -1.33, and -2.66 kg/m2 in normal, overweight, and obese categories, respectively. Despite the increasing degree of bias with progressively higher BMI categories, persons describing themselves as too heavy were, within any given BMI category, less likely to have under-estimated BMI (AOR 0.5, 99%CI: 0.3-0.8, P < 0.001), to be misclassified in a lower BMI category (AOR 0.3, 99%CI: 0.2-0.5, P < 0.001), to under-report weight (AOR 0.5, 99%CI: 0.3-0.7, P < 0.001), and to over-report height (OR 0.7, 99%CI: 0.6-1.0, P = 0.007).
A novel non-linear approach to examining weight, height, and BMI misreporting biases was developed. Perceiving oneself as too heavy appears to reduce rather than exacerbate weight, height, and BMI misreporting biases.
人们普遍认为,瘦高是一种文化压力,这导致人们报告的体重和身高向更符合社会规范(即理想)的数值靠拢,从而产生了偏差。然而,目前还缺乏直接的证据来支持这种观点。我们开发了一种新颖的非线性方法来检验体重、身高和 BMI 报告偏差,并利用这种方法来检验成年人中不符合社会规范的体重与报告偏差之间的关系。
本研究利用了爱尔兰共和国全国代表性调查“生活方式、态度和营养调查 2007 年(SLÁN 2007)”的数据(分析了 1942 名参与者)。自我报告的体重(身高)分为以下三种情况:报告的体重(身高)低于实际值≥2.0 公斤(2.0 厘米)、报告的体重(身高)高于实际值≥2.0 公斤(2.0 厘米)、或在 2.0 公斤(2.0 厘米)内准确报告,以考虑测量技术误差和体重(身高)的短期波动。我们使用模拟策略来定义基于自我报告的 BMI,将 BMI 低估超过 1.40 公斤/平方米、高估超过 1.40 公斤/平方米或准确估计在 1.40 公斤/平方米范围内的情况分别定义为低估、高估和准确估计。我们还探索了自我报告体重、身高和 BMI 偏差的模式。使用逻辑回归来确定与 BMI 估计不准确相关的因素,并计算调整后的优势比(AOR)和 99%置信区间(99%CI)。
对 BMI 估计偏差贡献最大的偏差模式是(1)体重报告值低于实际值且身高报告值高于实际值,(2)体重报告值低于实际值且身高报告值准确,以及(3)体重报告值准确且身高报告值高于实际值,这三种模式的影响依次递减。总体而言,自我报告 BMI 的平均偏差为-1.34 公斤/平方米,在正常、超重和肥胖的分类中,分别为-0.49、-1.33 和-2.66 公斤/平方米。尽管随着 BMI 分类的增加,偏差程度逐渐增加,但在任何给定的 BMI 分类中,自我描述为超重的人不太可能低估 BMI(AOR 0.5,99%CI:0.3-0.8,P < 0.001)、将自己分类为较低的 BMI 类别(AOR 0.3,99%CI:0.2-0.5,P < 0.001)、报告体重值偏低(AOR 0.5,99%CI:0.3-0.7,P < 0.001)或报告身高值偏高(OR 0.7,99%CI:0.6-1.0,P = 0.007)。
我们开发了一种新颖的非线性方法来检验体重、身高和 BMI 报告偏差。自我感觉超重似乎会降低而不是加剧体重、身高和 BMI 报告偏差。