Kalmijn W M, Arends L R, Veenhoven R
Erasmus University, Rotterdam, The Netherlands.
Soc Indic Res. 2011 Jul;102(3):497-515. doi: 10.1007/s11205-010-9688-2. Epub 2010 Aug 24.
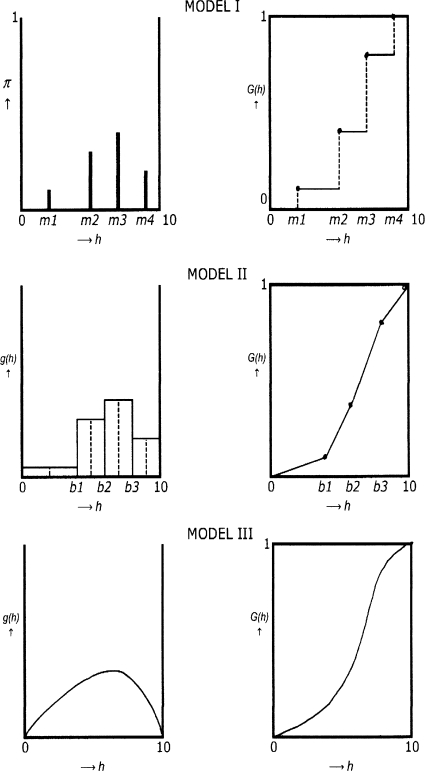
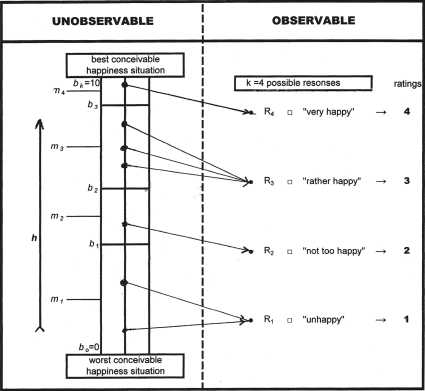
The Happiness Scale Interval Study deals with survey questions on happiness, using verbal response options, such as 'very happy' and 'pretty happy'. The aim is to estimate what degrees of happiness are denoted by such terms in different questions and languages. These degrees are expressed in numerical values on a continuous [0,10] scale, which are then used to compute 'transformed' means and standard deviations. Transforming scores on different questions to the same scale allows to broadening the World Database of Happiness considerably. The central purpose of the Happiness Scale Interval Study is to identify the happiness values at which respondents change their judgment from e.g. 'very happy' to 'pretty happy' or the reverse. This paper deals with the methodological/statistical aspects of this approach. The central question is always how to convert the frequencies at which the different possible responses to the same question given by a sample into information on the happiness distribution in the relevant population. The primary (cl)aim of this approach is to achieve this in a (more) valid way. To this end, a model is introduced that allows for dealing with happiness as a latent continuous random variable, in spite of the fact that it is measured as a discrete one. The [0,10] scale is partitioned in as many contiguous parts as the number of possible ratings in the primary scale sums up to. Any subject with a (self-perceived) happiness in the same subinterval is assumed to select the same response. For the probability density function of this happiness random variable, two options are discussed. The first one postulates a uniform distribution within each of the different subintervals of the [0,10] scale. On the basis of these results, the mean value and variance of the complete distribution can be estimated. The method is described, including the precision of the estimates obtained in this way. The second option assumes the happiness distribution to be described as a beta distribution on the interval [0,10] with two shape parameters (α and β). From their estimates on the basis of the primary information, the mean value and the variance of the happiness distribution in the population can be estimated. An illustration is given in which the method is applied to existing measurement results of 20 surveys in The Netherlands in the period 1990-2008. The results clarify our recommendation to apply the model with a uniform distribution within each of the category intervals, in spite of a better validity of the alternative on the basis of a beta distribution. The reason is that the recommended model allows to construct a confidence interval for the true but unknown population happiness distribution. The paper ends with a listing of actual and potential merits of this approach, which has been described here for verbal happiness questions, but which is also applicable to phenomena which are measured along similar lines.
幸福量表区间研究涉及有关幸福的调查问题,采用诸如“非常幸福”和“相当幸福”等文字回答选项。其目的是估计在不同问题和语言中这些术语所表示的幸福程度。这些程度用连续的[0,10]量表上的数值表示,然后用于计算“转换后的”均值和标准差。将不同问题的分数转换到同一量表上能够大幅扩充世界幸福数据库。幸福量表区间研究的核心目的是确定受访者在何种幸福值时会改变其判断,比如从“非常幸福”变为“相当幸福”或相反。本文探讨这种方法的方法学/统计学方面。核心问题始终是如何将样本对同一问题给出的不同可能回答的频率转换为相关总体中幸福分布的信息。这种方法的主要(核心)目标是以一种(更)有效的方式实现这一点。为此,引入了一个模型,该模型允许将幸福视为一个潜在的连续随机变量,尽管它是以离散变量来测量的。[0,10]量表被划分成与原量表中可能评级的数量相同的连续部分。任何在同一子区间内(自我感知)幸福程度相同的受试者都被假定会选择相同的回答。对于这个幸福随机变量的概率密度函数,讨论了两种选择。第一种假设在[0,10]量表的每个不同子区间内呈均匀分布。基于这些结果,可以估计完整分布的均值和方差。描述了该方法,包括以此方式获得的估计值的精度。第二种选择假设幸福分布在区间[0,10]上被描述为具有两个形状参数(α和β)的贝塔分布。根据基于原始信息的估计值,可以估计总体中幸福分布的均值和方差。给出了一个示例,其中该方法应用于1990 - 2008年荷兰20项调查的现有测量结果。结果阐明了我们的建议,即应用在每个类别区间内呈均匀分布的模型,尽管基于贝塔分布的另一种选择具有更好的有效性。原因是推荐的模型允许为真实但未知的总体幸福分布构建置信区间。本文最后列出了这种方法的实际和潜在优点,这里针对文字幸福问题描述了该方法,但它也适用于以类似方式测量的现象。