Department of Biostatistics, University of California Los Angeles, School of Public Health, USA.
BMC Bioinformatics. 2011 Sep 14;12:367. doi: 10.1186/1471-2105-12-367.
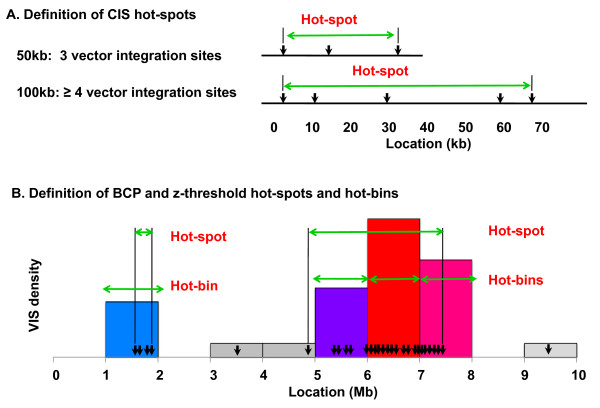
Modern gene therapy methods have limited control over where a therapeutic viral vector inserts into the host genome. Vector integration can activate local gene expression, which can cause cancer if the vector inserts near an oncogene. Viral integration hot-spots or 'common insertion sites' (CIS) are scrutinized to evaluate and predict patient safety. CIS are typically defined by a minimum density of insertions (such as 2-4 within a 30-100 kb region), which unfortunately depends on the total number of observed VIS. This is problematic for comparing hot-spot distributions across data sets and patients, where the VIS numbers may vary.
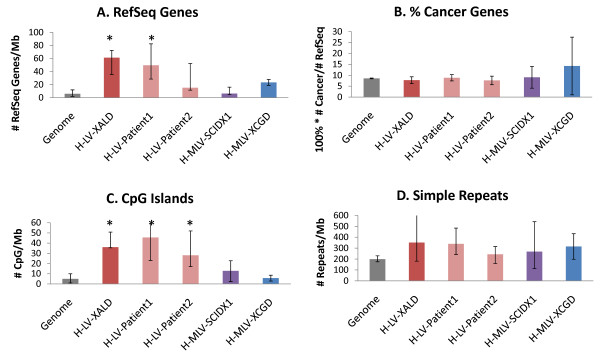
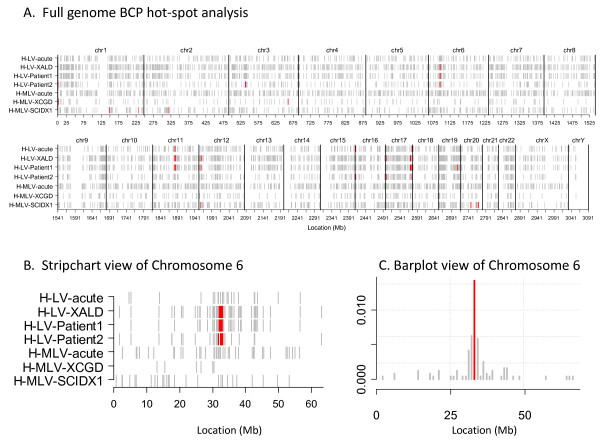
We develop two new methods for defining hot-spots that are relatively independent of data set size. Both methods operate on distributions of VIS across consecutive 1 Mb 'bins' of the genome. The first method 'z-threshold' tallies the number of VIS per bin, converts these counts to z-scores, and applies a threshold to define high density bins. The second method 'BCP' applies a Bayesian change-point model to the z-scores to define hot-spots. The novel hot-spot methods are compared with a conventional CIS method using simulated data sets and data sets from five published human studies, including the X-linked ALD (adrenoleukodystrophy), CGD (chronic granulomatous disease) and SCID-X1 (X-linked severe combined immunodeficiency) trials. The BCP analysis of the human X-linked ALD data for two patients separately (774 and 1627 VIS) and combined (2401 VIS) resulted in 5-6 hot-spots covering 0.17-0.251% of the genome and containing 5.56-7.74% of the total VIS. In comparison, the CIS analysis resulted in 12-110 hot-spots covering 0.018-0.246% of the genome and containing 5.81-22.7% of the VIS, corresponding to a greater number of hot-spots as the data set size increased. Our hot-spot methods enable one to evaluate the extent of VIS clustering, and formally compare data sets in terms of hot-spot overlap. Finally, we show that the BCP hot-spots from the repopulating samples coincide with greater gene and CpG island density than the median genome density.
The z-threshold and BCP methods are useful for comparing hot-spot patterns across data sets of disparate sizes. The methodology and software provided here should enable one to study hot-spot conservation across a variety of VIS data sets and evaluate vector safety for gene therapy trials.
现代基因治疗方法对治疗性病毒载体在宿主基因组中的插入位置的控制能力有限。载体整合可激活局部基因表达,如果载体插入到癌基因附近,可能会导致癌症。病毒整合热点或“常见插入位点”(CIS)被仔细研究,以评估和预测患者的安全性。CIS 通常通过插入的最小密度来定义(例如,在 30-100 kb 区域内插入 2-4 个),但不幸的是,这取决于观察到的 VIS 总数。这在比较不同数据集和患者之间的热点分布时存在问题,其中 VIS 数量可能会有所不同。
我们开发了两种新的方法来定义热点,这些方法相对独立于数据集的大小。这两种方法都在基因组的连续 1 Mb“箱”中对 VIS 的分布进行操作。第一种方法“z 阈值”对每个箱中的 VIS 数量进行计数,将这些计数转换为 z 分数,并应用阈值来定义高密度箱。第二种方法“BCP”将贝叶斯变化点模型应用于 z 分数以定义热点。使用模拟数据集和来自五个已发表的人类研究的数据集(包括 X 连锁肾上腺脑白质营养不良(ALD)、CGD(慢性肉芽肿病)和 SCID-X1(X 连锁严重联合免疫缺陷)试验)比较了新颖的热点方法和传统的 CIS 方法。对两名患者(774 和 1627 个 VIS)和合并(2401 个 VIS)的人类 X 连锁 ALD 数据的 BCP 分析分别产生了 5-6 个热点,覆盖了基因组的 0.17-0.251%,包含了 VIS 的 5.56-7.74%。相比之下,CIS 分析产生了 12-110 个热点,覆盖了基因组的 0.018-0.246%,包含了 VIS 的 5.81-22.7%,这对应于随着数据集大小的增加而出现更多热点的情况。我们的热点方法使人们能够评估 VIS 聚类的程度,并从热点重叠的角度正式比较数据集。最后,我们表明,重新填充样本中的 BCP 热点与更大的基因和 CpG 岛密度重合,而不是与中位数基因组密度重合。
z 阈值和 BCP 方法可用于比较不同大小数据集之间的热点模式。这里提供的方法和软件应该能够使人们研究各种 VIS 数据集之间的热点保存情况,并评估基因治疗试验中载体的安全性。