Hazra Avijit, Gogtay Nithya
Department of Pharmacology, Institute of Postgraduate Medical Education and Research, Kolkata, West Bengal, India.
Department of Clinical Pharmacology, Seth GS Medical College and KEM Hospital, Parel, Mumbai, Maharashtra, India.
Indian J Dermatol. 2016 May-Jun;61(3):251-60. doi: 10.4103/0019-5154.182416.
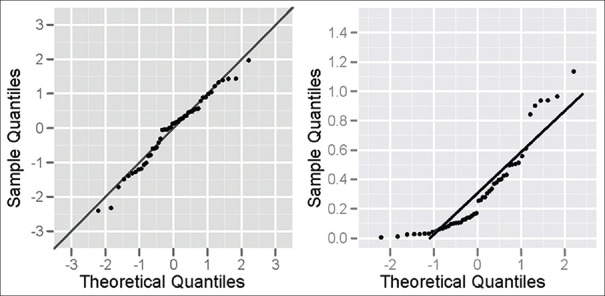
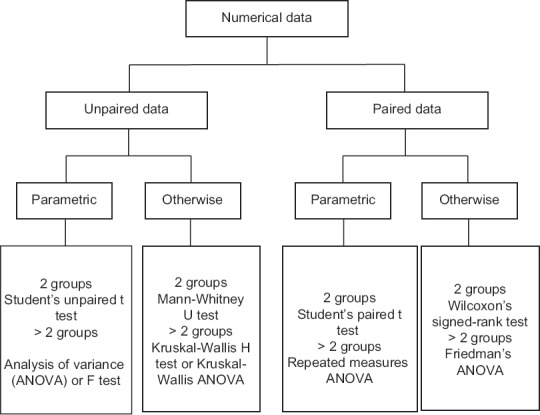
Numerical data that are normally distributed can be analyzed with parametric tests, that is, tests which are based on the parameters that define a normal distribution curve. If the distribution is uncertain, the data can be plotted as a normal probability plot and visually inspected, or tested for normality using one of a number of goodness of fit tests, such as the Kolmogorov-Smirnov test. The widely used Student's t-test has three variants. The one-sample t-test is used to assess if a sample mean (as an estimate of the population mean) differs significantly from a given population mean. The means of two independent samples may be compared for a statistically significant difference by the unpaired or independent samples t-test. If the data sets are related in some way, their means may be compared by the paired or dependent samples t-test. The t-test should not be used to compare the means of more than two groups. Although it is possible to compare groups in pairs, when there are more than two groups, this will increase the probability of a Type I error. The one-way analysis of variance (ANOVA) is employed to compare the means of three or more independent data sets that are normally distributed. Multiple measurements from the same set of subjects cannot be treated as separate, unrelated data sets. Comparison of means in such a situation requires repeated measures ANOVA. It is to be noted that while a multiple group comparison test such as ANOVA can point to a significant difference, it does not identify exactly between which two groups the difference lies. To do this, multiple group comparison needs to be followed up by an appropriate post hoc test. An example is the Tukey's honestly significant difference test following ANOVA. If the assumptions for parametric tests are not met, there are nonparametric alternatives for comparing data sets. These include Mann-Whitney U-test as the nonparametric counterpart of the unpaired Student's t-test, Wilcoxon signed-rank test as the counterpart of the paired Student's t-test, Kruskal-Wallis test as the nonparametric equivalent of ANOVA and the Friedman's test as the counterpart of repeated measures ANOVA.
呈正态分布的数值数据可用参数检验进行分析,即基于定义正态分布曲线的参数的检验。如果分布情况不确定,可以将数据绘制成正态概率图并进行直观检查,或者使用多种拟合优度检验方法之一(如柯尔莫哥洛夫 - 斯米尔诺夫检验)来检验数据是否符合正态分布。广泛使用的学生 t 检验有三种变体。单样本 t 检验用于评估样本均值(作为总体均值的估计值)与给定总体均值是否存在显著差异。对于两个独立样本的均值,可以通过成组或独立样本 t 检验来比较是否存在统计学上的显著差异。如果数据集在某种程度上相关,则可以通过配对或相关样本 t 检验来比较它们的均值。t 检验不应用于比较两组以上的均值。虽然可以成对比较组,但当有两组以上时,这会增加 I 型错误的概率。单向方差分析(ANOVA)用于比较三个或更多呈正态分布的独立数据集的均值。同一组受试者的多次测量不能视为单独的、不相关的数据集。在这种情况下比较均值需要使用重复测量方差分析。需要注意的是,虽然像 ANOVA 这样的多组比较检验可以指出存在显著差异,但它并不能确切确定差异存在于哪两组之间。要做到这一点,多组比较之后需要进行适当的事后检验。例如,ANOVA 之后进行的图基真实显著差异检验。如果不满足参数检验的假设,则有用于比较数据集的非参数替代方法。这些方法包括曼 - 惠特尼 U 检验,它是成组学生 t 检验的非参数对应方法;威尔科克森符号秩检验,它是配对学生 t 检验的对应方法;克鲁斯卡尔 - 沃利斯检验,它是 ANOVA 的非参数等效方法;以及弗里德曼检验,它是重复测量方差分析的对应方法。