Kabir M S, Salam M A, Paul D N R, Hossain M I, Rahman N M F, Aziz Abdullah, Latif M A
Bangladesh Rice Research Institute (BRRI), Gazipur, Bangladesh.
Department of Statistics, Jahangirnagar University, Savar, Dhaka, Bangladesh.
ScientificWorldJournal. 2016;2016:2186069. doi: 10.1155/2016/2186069. Epub 2016 Sep 26.
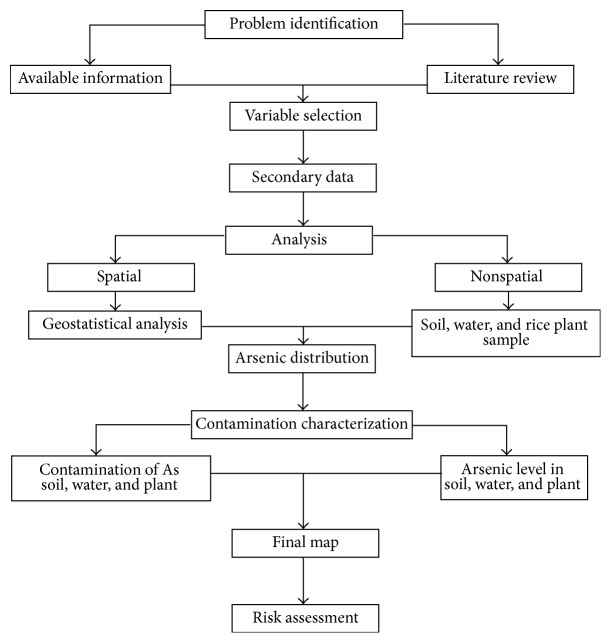
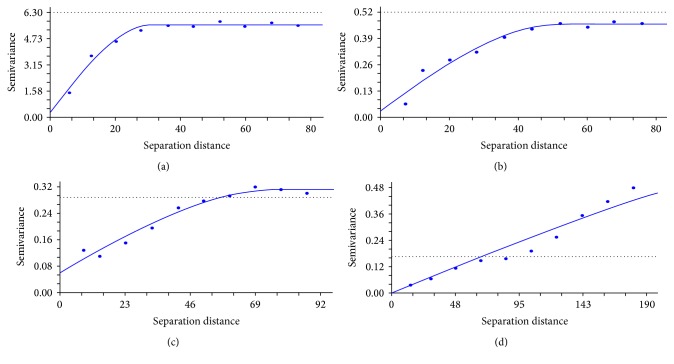
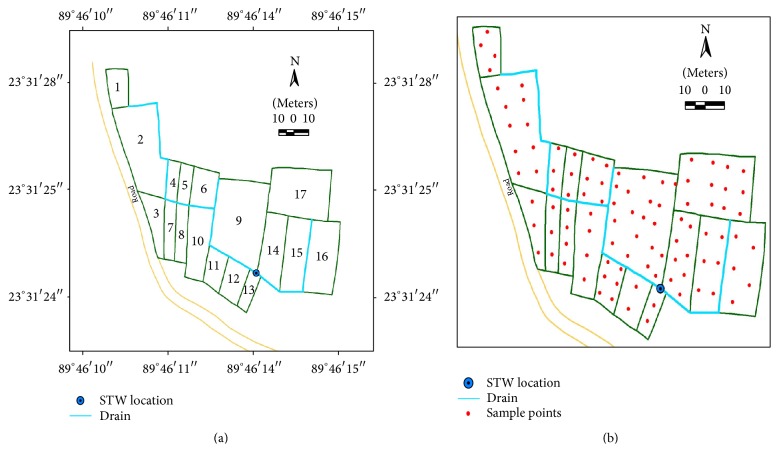
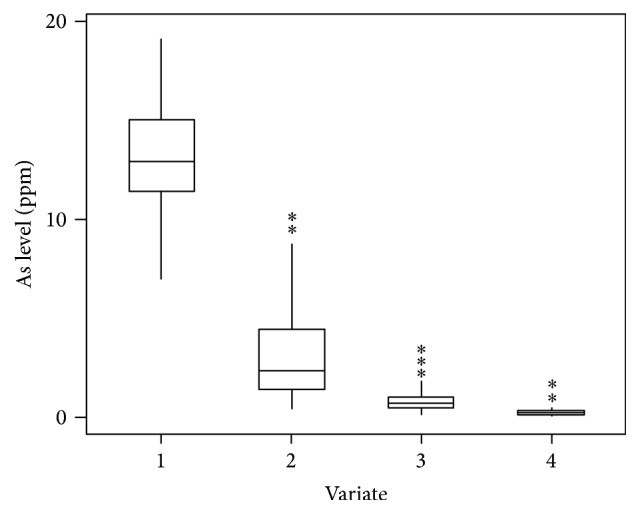
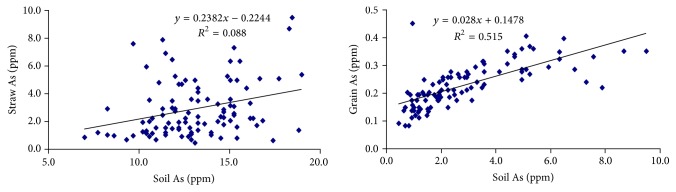
Arsenic pollution became a great problem in the recent past in different countries including Bangladesh. The microlevel studies were conducted to see the spatial variation of arsenic in soils and plant parts contaminated through ground water irrigation. The study was performed in shallow tube well command areas in Sadar Upazila (subdistrict), Faridpur, Bangladesh, where both soil and irrigation water arsenic are high. Semivariogram models were computed to determine the spatial dependency of soil, water, grain, straw, and husk arsenic (As). An arsenic concentration surface was created spatially to describe the distribution of arsenic in soil, water, grain, straw, and husk. Command area map was digitized using Arcview GIS from the "mouza" map. Both arsenic contaminated irrigation water and the soils were responsible for accumulation of arsenic in rice straw, husk, and grain. The accumulation of arsenic was higher in water followed by soil, straw, husk, and grain. Arsenic concentration varied widely within command areas. The extent and propensity of arsenic concentration were higher in areas where high concentration of arsenic existed in groundwater and soils. Spherical model was a relatively better and appropriate model. Kriging method appeared to be more suitable in creating interpolated surface. The average arsenic content in grain was 0.08-0.45 mg/kg while in groundwater arsenic level it ranged from 138.0 to 191.3 ppb.
近年来,包括孟加拉国在内的不同国家,砷污染已成为一个重大问题。开展微观层面的研究,以观察通过地下水灌溉而受污染的土壤和植物部分中砷的空间变化。该研究在孟加拉国法里德布尔县萨达尔乌帕齐拉(乡)的浅管井控制区进行,那里土壤和灌溉水中的砷含量都很高。计算了半变异函数模型,以确定土壤、水、谷粒、稻草和稻壳中砷(As)的空间依赖性。在空间上创建了一个砷浓度表面,以描述土壤、水、谷粒、稻草和稻壳中砷的分布情况。利用Arcview GIS软件从“穆扎”地图中数字化了控制区地图。受砷污染的灌溉水和土壤都是稻草、稻壳和谷粒中砷积累的原因。砷在水中的积累量最高,其次是土壤、稻草、稻壳和谷粒。控制区内砷浓度差异很大。在地下水和土壤中砷浓度高的地区,砷浓度的范围和倾向更高。球状模型是一个相对较好且合适的模型。克里金法似乎更适合创建插值表面。谷粒中的平均砷含量为0.08 - 0.45毫克/千克,而地下水中的砷含量范围为138.0至191.3 ppb。