National Engineering and Technology Center for Information Agriculture, Key Laboratory for Crop System Analysis and Decision Making, Ministry of Agriculture, Jiangsu Key Laboratory for Information Agriculture, Jiangsu Collaborative Innovation Center for Modern Crop Production, Nanjing Agricultural University, Nanjing 210095, China.
Department of Agronomy and Horticulture, University of Nebraska-Lincoln, Lincoln, NE 68583, USA.
Sensors (Basel). 2017 Mar 24;17(4):672. doi: 10.3390/s17040672.
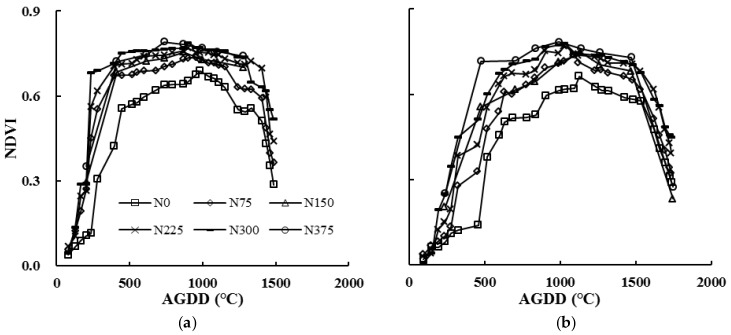
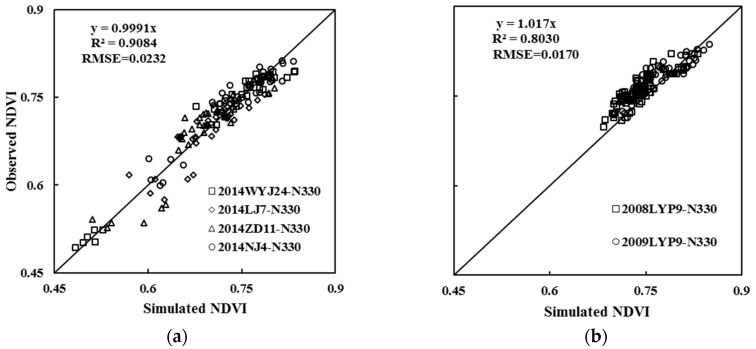
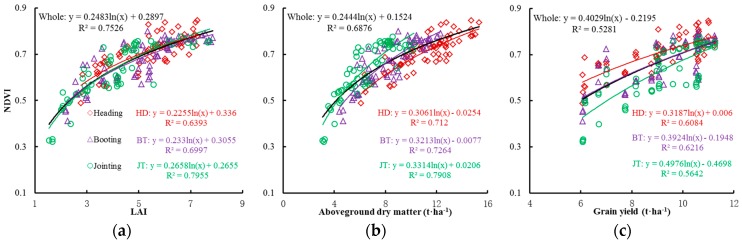
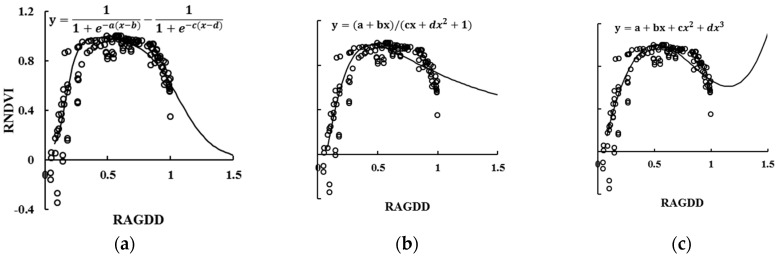
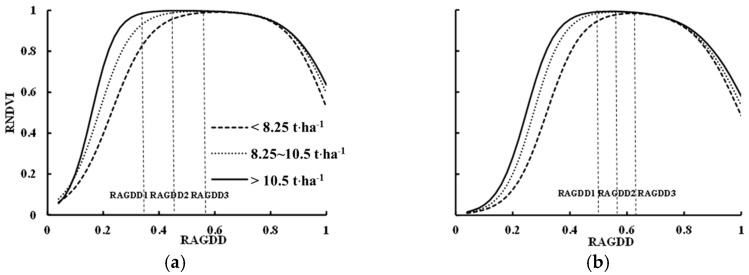
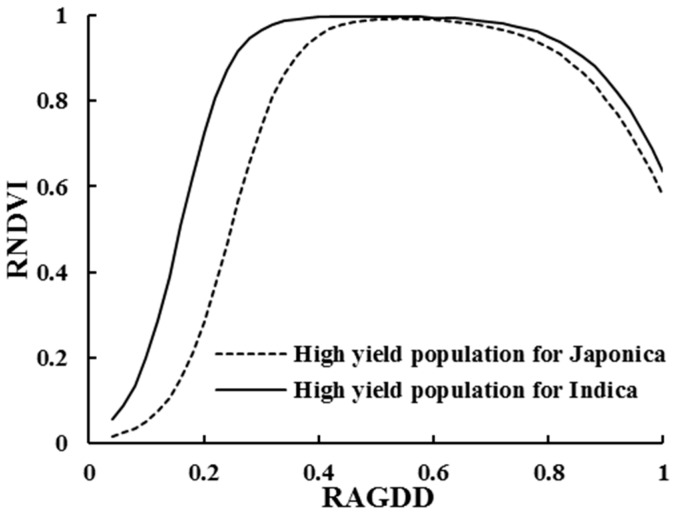
The successful development of an optimal canopy vegetation index dynamic model for obtaining higher yield can offer a technical approach for real-time and nondestructive diagnosis of rice (Oryza sativa L) growth and nitrogen (N) nutrition status. In this study, multiple rice cultivars and N treatments of experimental plots were carried out to obtain: normalized difference vegetation index (NDVI), leaf area index (LAI), above-ground dry matter (DM), and grain yield (GY) data. The quantitative relationships between NDVI and these growth indices (e.g., LAI, DM and GY) were analyzed, showing positive correlations. Using the normalized modeling method, an appropriate NDVI simulation model of rice was established based on the normalized NDVI (RNDVI) and relative accumulative growing degree days (RAGDD). The NDVI dynamic model for high-yield production in rice can be expressed by a double logistic model: RNDVI = ( 1 + e - 15.2829 × ( R A G D D i - 0.1944 ) ) - 1 - ( 1 + e - 11.6517 × ( R A G D D i - 1.0267 ) ) - 1 (R2 = 0.8577**), which can be used to accurately predict canopy NDVI dynamic changes during the entire growth period. Considering variation among rice cultivars, we constructed two relative NDVI (RNDVI) dynamic models for Japonica and Indica rice types, with R2 reaching 0.8764** and 0.8874**, respectively. Furthermore, independent experimental data were used to validate the RNDVI dynamic models. The results showed that during the entire growth period, the accuracy (k), precision (R2), and standard deviation of RNDVI dynamic models for the Japonica and Indica cultivars were 0.9991, 1.0170; 0.9084**, 0.8030**; and 0.0232, 0.0170, respectively. These results indicated that RNDVI dynamic models could accurately reflect crop growth and predict dynamic changes in high-yield crop populations, providing a rapid approach for monitoring rice growth status.
建立优化的冠层植被指数动态模型以获得更高的产量,可为水稻(Oryza sativa L)生长和氮(N)营养状况的实时和无损诊断提供技术方法。本研究通过多个水稻品种和实验小区的氮肥处理,获得归一化植被指数(NDVI)、叶面积指数(LAI)、地上干物质(DM)和产量(GY)数据。分析了 NDVI 与这些生长指标(如 LAI、DM 和 GY)之间的定量关系,结果表明它们之间存在正相关。利用归一化建模方法,基于归一化 NDVI(RNDVI)和相对累积生长度日(RAGDD),建立了一个合适的水稻 NDVI 模拟模型。水稻高产 NDVI 动态模型可表示为双逻辑模型:RNDVI = (1+e-15.2829×(RAGDDi-0.1944))-1-(1+e-11.6517×(RAGDDi-1.0267))-1(R2=0.8577**),可用于准确预测整个生育期内冠层 NDVI 的动态变化。考虑到水稻品种间的差异,我们构建了两个籼稻和粳稻类型的相对 NDVI(RNDVI)动态模型,R2 分别达到 0.8764和 0.8874。此外,还使用独立的实验数据对 RNDVI 动态模型进行了验证。结果表明,在整个生长期间,籼稻和粳稻品种的 RNDVI 动态模型的准确性(k)、精度(R2)和标准偏差分别为 0.9991、1.0170;0.9084**、0.8030**;0.0232、0.0170。这些结果表明,RNDVI 动态模型能够准确反映作物生长情况,并预测高产作物群体的动态变化,为监测水稻生长状况提供了一种快速方法。