Department of Health Policy and Management, Harvard T.H. Chan School of Public Health, Boston, MA, USA (AP, SS, SA, MCW, TAG).
Department of Biomedical Informatics, Columbia University, New York, NY, USA (SC).
Med Decis Making. 2017 Oct;37(7):802-814. doi: 10.1177/0272989X17706081. Epub 2017 May 10.
Despite some advances, cardiovascular disease (CVD) remains the leading cause of death and healthcare costs in the United States. We therefore developed a comprehensive CVD policy simulation model that identifies cost-effective approaches for reducing CVD burden. This paper aims to: 1) describe our model in detail; and 2) perform model validation analyses.
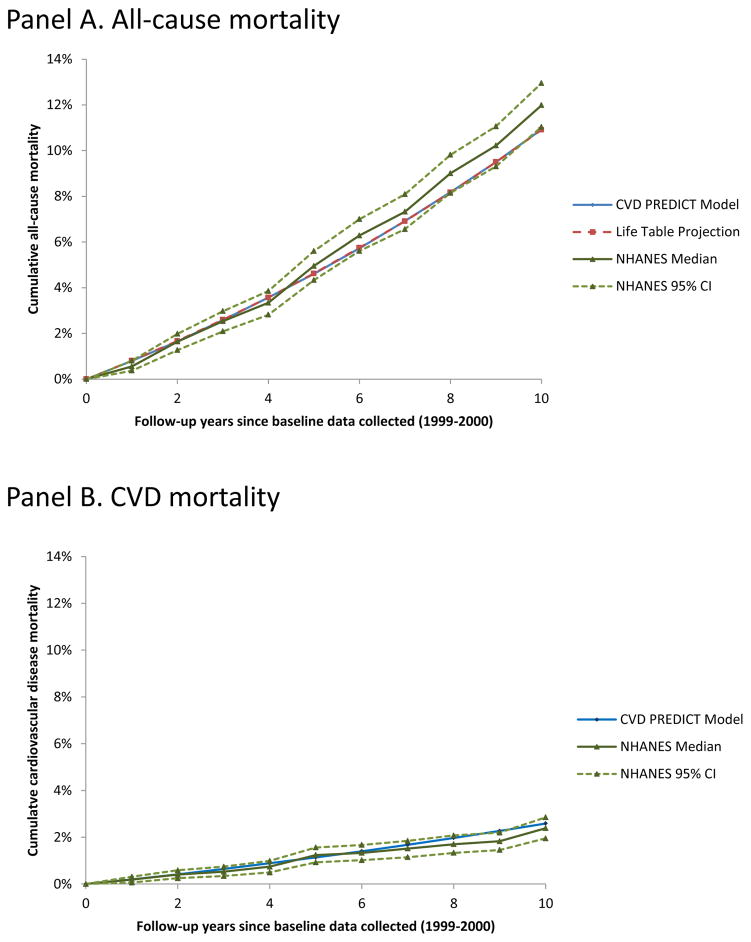
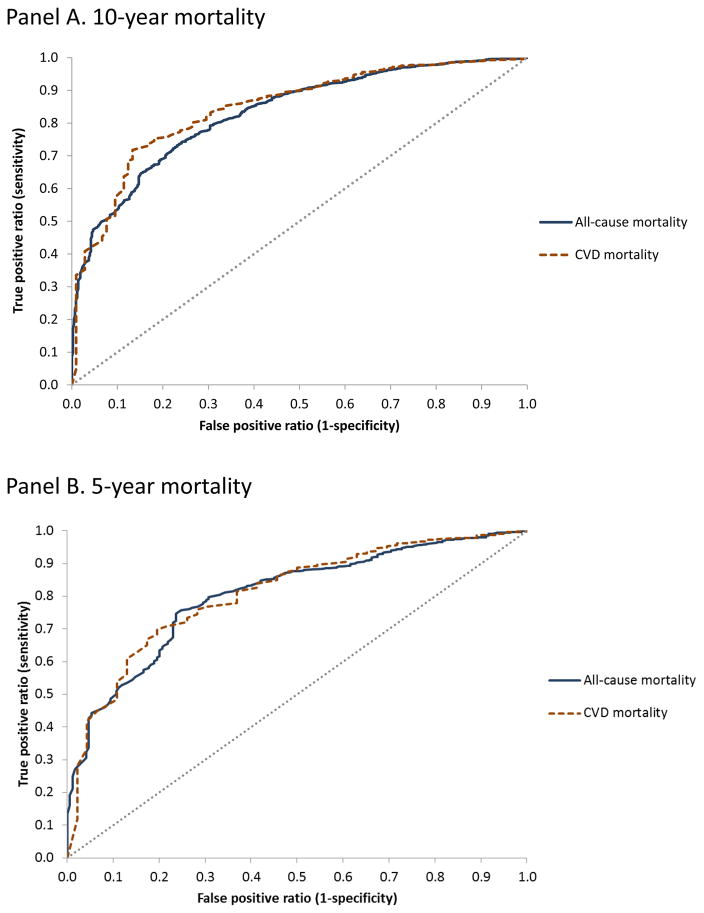
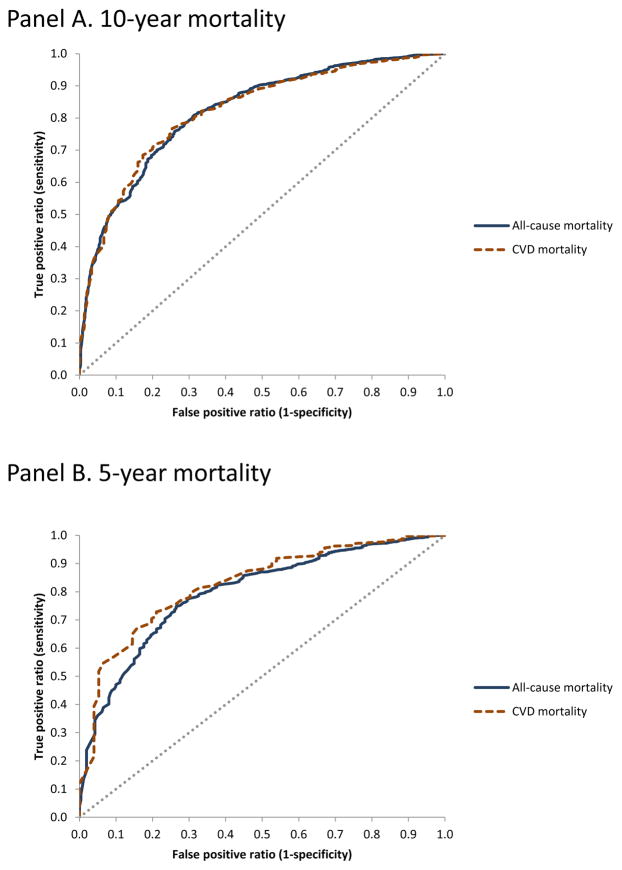
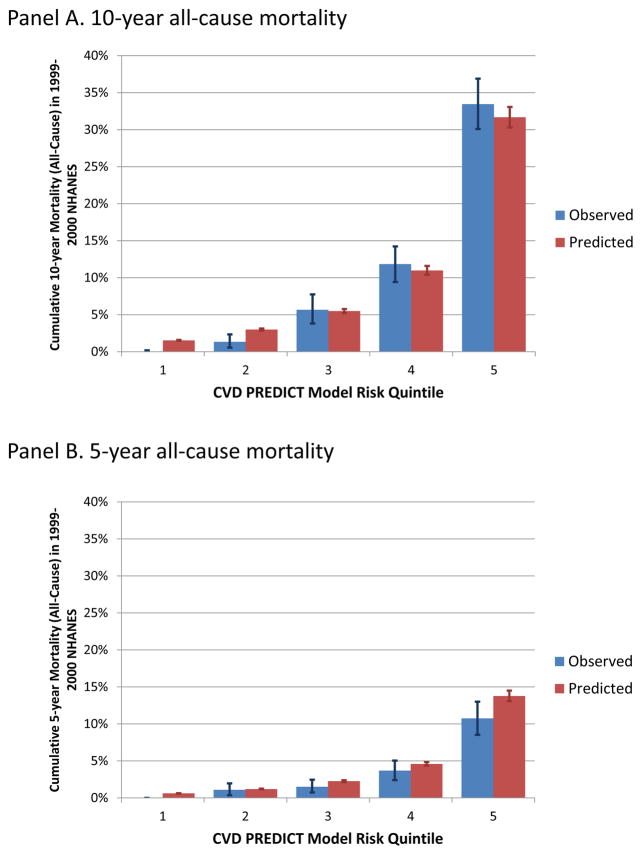
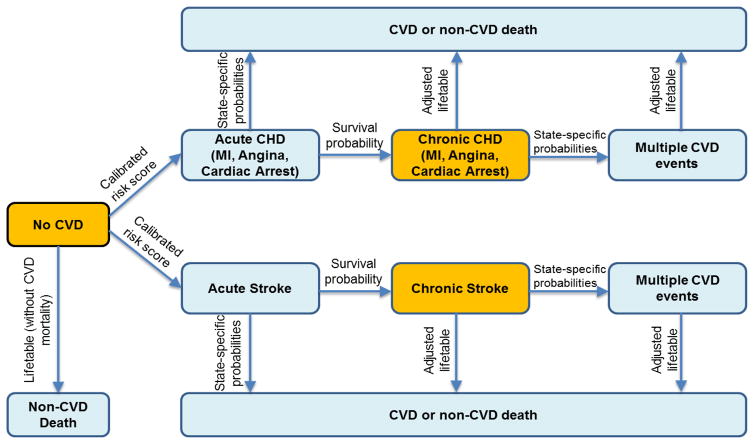
The model simulates 1,000,000 adults (ages 35 to 80 years) using a variety of CVD-related epidemiological data, including previously calibrated Framingham-based risk scores for coronary heart disease and stroke. We validated our microsimulation model using recent National Health and Nutrition Examination Survey (NHANES) data, with baseline values collected in 1999-2000 and cause-specific mortality follow-up through 2011. Model-based (simulated) results were compared to observed all-cause and CVD-specific mortality data (from NHANES) for the same starting population using survival curves and, in a method not typically used for disease model validation, receiver operating characteristic (ROC) curves.
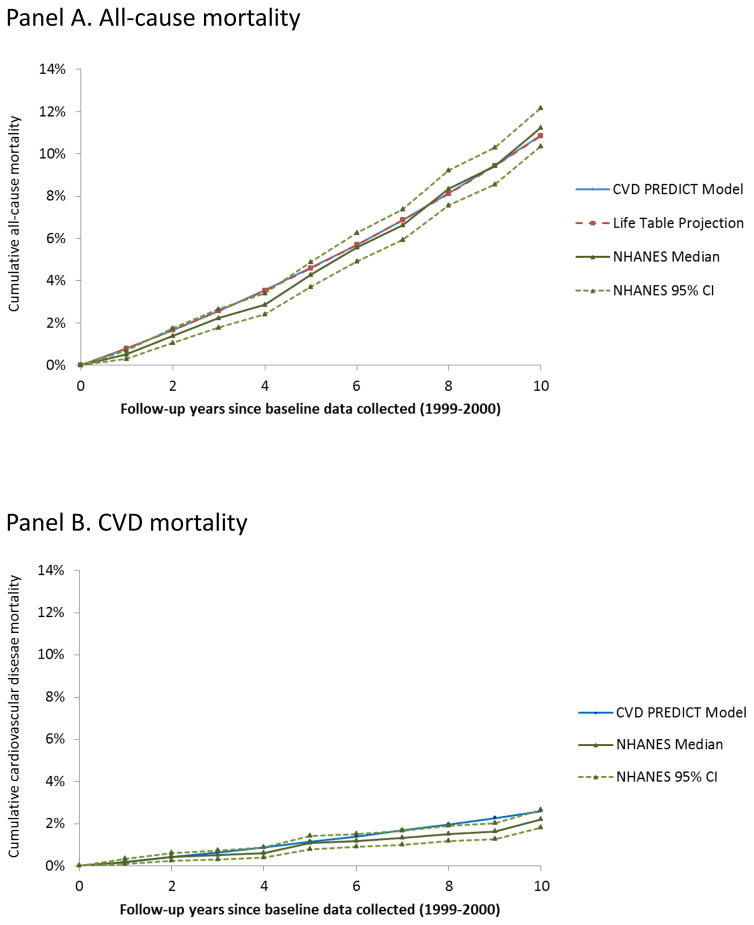
Observed 10-year all-cause mortality in NHANES v. the simulation model was 11.2% (95% CI, 10.3% to 12.2%) v. 10.9%; corresponding results for CVD mortality were 2.2% (1.8% to 2.7%) v. 2.6%. Areas under the ROC curves for model-predicted 10-year all-cause and CVD mortality risks were 0.83 (0.81 to 0.85) and 0.84 (0.81 to 0.88), respectively; corresponding results for 5-year risks were 0.80 (0.77 to 0.83) and 0.81 (0.75 to 0.87), respectively.
The model is limited by the uncertainties in the data used to estimate its input parameters. Additionally, our validation analyses did not include non-fatal CVD outcomes due to NHANES data limitations.
The simulation model performed well in matching to observed nationally representative longitudinal mortality data. ROC curve analysis, which has been traditionally used for risk prediction models, can also be used to assess discrimination for disease simulation models.
尽管取得了一些进展,但心血管疾病 (CVD) 仍然是美国死亡和医疗保健费用的主要原因。因此,我们开发了一种综合的 CVD 政策模拟模型,旨在确定降低 CVD 负担的具有成本效益的方法。本文旨在:1) 详细描述我们的模型;2) 进行模型验证分析。
该模型使用各种 CVD 相关的流行病学数据模拟了 100 万成年人(35 至 80 岁),包括之前基于弗雷明汉风险评分的冠心病和中风的冠状动脉疾病风险评分。我们使用最近的国家健康和营养检查调查 (NHANES) 数据对我们的微观模拟模型进行了验证,基线值采集于 1999-2000 年,特定原因死亡率随访至 2011 年。使用生存曲线和一种通常不用于疾病模型验证的方法(接收者操作特征 (ROC) 曲线),将基于模型(模拟)的结果与具有相同起始人群的 NHANES 的全因和 CVD 特异性死亡率数据(来自 NHANES)进行比较。
NHANES 观察到的 10 年全因死亡率为 11.2%(95%CI,10.3%至 12.2%),模拟模型为 10.9%;相应的 CVD 死亡率结果为 2.2%(1.8%至 2.7%),模拟模型为 2.6%。模型预测的 10 年全因和 CVD 死亡率风险的 ROC 曲线下面积分别为 0.83(0.81 至 0.85)和 0.84(0.81 至 0.88);相应的 5 年风险结果分别为 0.80(0.77 至 0.83)和 0.81(0.75 至 0.87)。
该模型受到用于估计其输入参数的数据不确定性的限制。此外,由于 NHANES 数据的限制,我们的验证分析不包括非致命性 CVD 结果。
模拟模型在匹配全国代表性纵向死亡率数据方面表现良好。ROC 曲线分析,传统上用于风险预测模型,也可用于评估疾病模拟模型的区分度。