Department of Occupational Medicine, Haukeland University Hospital, Bergen, Norway.
Department of Global Public Health and Primary Care, Centre for International Health, University of Bergen, Bergen, Norway.
PLoS One. 2018 Apr 25;13(4):e0195697. doi: 10.1371/journal.pone.0195697. eCollection 2018.
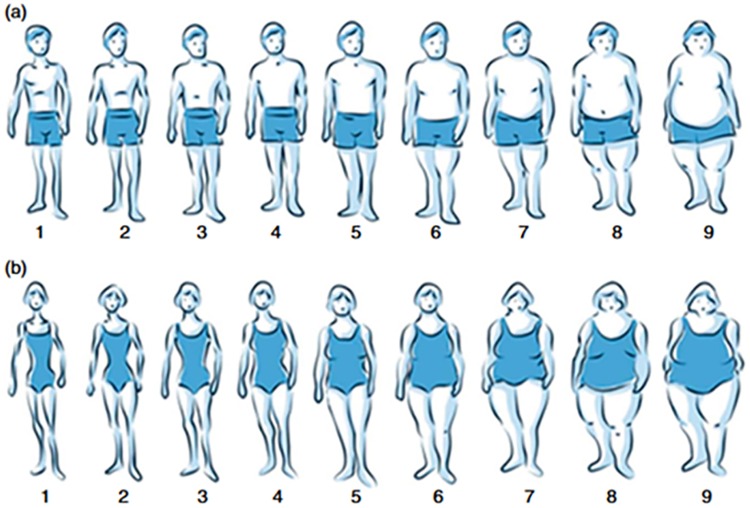
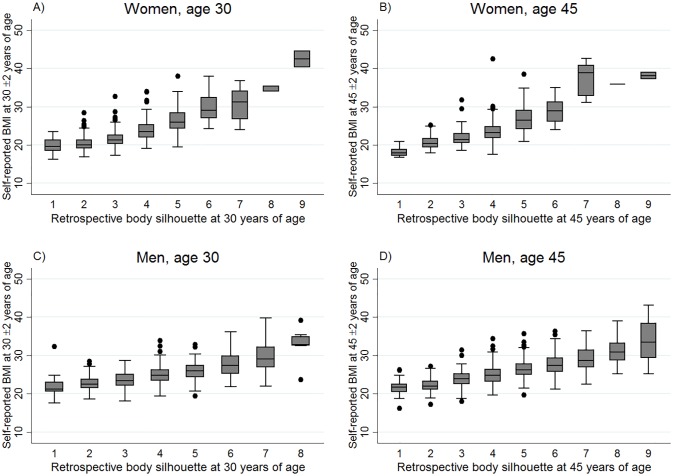
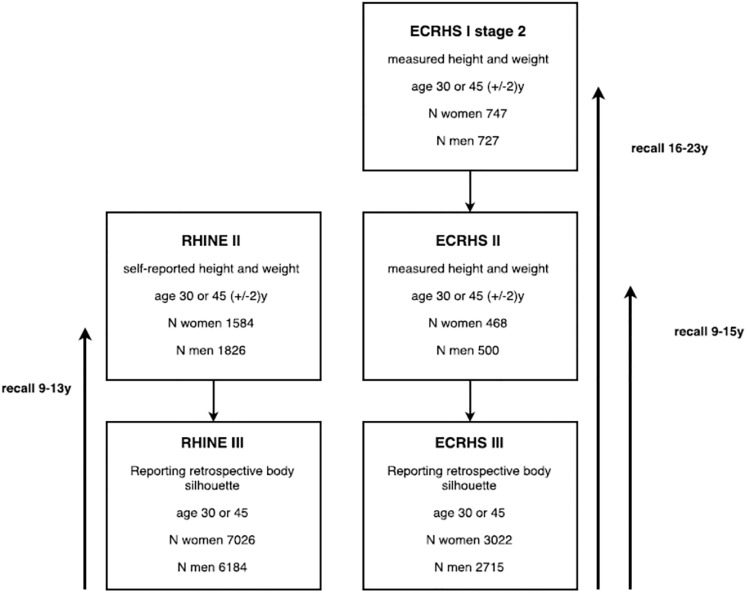
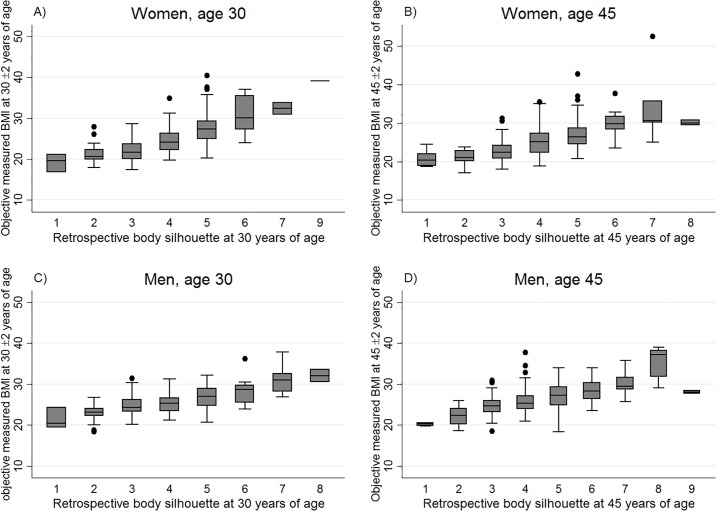
Life course data on obesity may enrich the quality of epidemiologic studies analysing health consequences of obesity. However, achieving such data may require substantial resources. We investigated the use of body silhouettes in adults as a tool to reflect obesity in the past. We used large population-based samples to analyse to what extent self-reported body silhouettes correlated with the previously measured (9-23 years) body mass index (BMI) from both measured (European Community Respiratory Health Survey, N = 3 041) and self-reported (Respiratory Health In Northern Europe study, N = 3 410) height and weight. We calculated Spearman correlation between BMI and body silhouettes and ROC-curve analyses for identifying obesity (BMI ≥30) at ages 30 and 45 years. Spearman correlations between measured BMI age 30 (±2y) or 45 (±2y) and body silhouettes in women and men were between 0.62-0.66 and correlations for self-reported BMI were between 0.58-0.70. The area under the curve for identification of obesity at age 30 using body silhouettes vs previously measured BMI at age 30 (±2y) was 0.92 (95% CI 0.87, 0.97) and 0.85 (95% CI 0.75, 0.95) in women and men, respectively; for previously self-reported BMI, 0.92 (95% CI 0.88, 0.95) and 0.90 (95% CI 0.85, 0.96). Our study suggests that body silhouettes are a useful epidemiological tool, enabling retrospective differentiation of obesity and non-obesity in adult women and men.
人生历程中有关肥胖的数据可以丰富分析肥胖对健康影响的流行病学研究的质量。然而,获得这些数据可能需要大量的资源。我们研究了使用成人身体轮廓图作为反映过去肥胖情况的工具。我们使用了大型基于人群的样本,分析了自我报告的身体轮廓图与之前测量的(欧洲社区呼吸健康调查,N=3041)和自我报告的(北欧呼吸健康研究,N=3410)身高和体重所测量的(身体质量指数(BMI))之间的相关性。我们计算了 BMI 与身体轮廓图之间的斯皮尔曼相关系数,并对识别 30 岁和 45 岁时的肥胖症(BMI≥30)的 ROC 曲线分析。女性和男性中,30 岁(±2 岁)或 45 岁(±2 岁)时测量的 BMI 与身体轮廓图之间的斯皮尔曼相关系数分别为 0.62-0.66,而自我报告的 BMI 之间的相关系数为 0.58-0.70。使用身体轮廓图与 30 岁时之前测量的 BMI(±2 岁)来识别 30 岁时肥胖的曲线下面积(AUC)分别为 0.92(95%CI 0.87,0.97)和 0.85(95%CI 0.75,0.95),在女性和男性中;对于之前的自我报告的 BMI,分别为 0.92(95%CI 0.88,0.95)和 0.90(95%CI 0.85,0.96)。我们的研究表明,身体轮廓图是一种有用的流行病学工具,可以在成年女性和男性中进行肥胖和非肥胖的回顾性区分。