Lund University, Department of Clinical Sciences Malmö, Clinical and Molecular Osteoporosis Research Unit, 20502, Malmö, Sweden.
Department of Orthopaedics, Skåne University Hospital, 205 02, Malmö, Sweden.
Osteoporos Int. 2018 Oct;29(10):2191-2199. doi: 10.1007/s00198-018-4593-7. Epub 2018 Jun 12.
In community dwelling, 75-year-old women followed 10 years, a frailty index was created at each of three visits. Frailty score increased by ~ 6-7% annually. A higher frailty score was equivalent to being 5-10 years chronologically older. Frailty was associated with low bone density and higher risk of dying.
To understand the distribution of frailty among a population-based sample of older community-dwelling women, progression over 10 years, and association with mortality and osteoporosis.
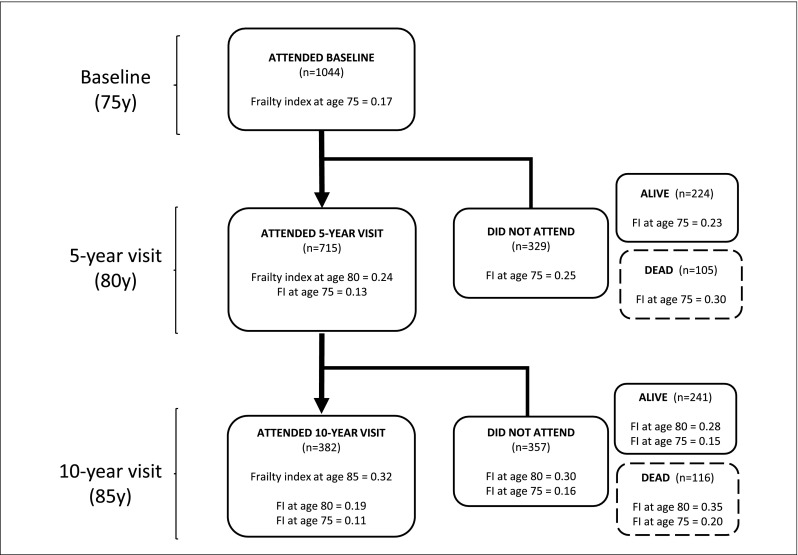
The study is performed in a cohort designed to investigate osteoporosis. The OPRA cohort consists of 75-year-old women, n = 1044 at baseline, and follow-up at age 80 and 85. A frailty index (scored from 0.0-1.0) based on deficits in health across multiple domains was created at all time-points; outcomes were mortality up to 15 years and femoral neck bone density.
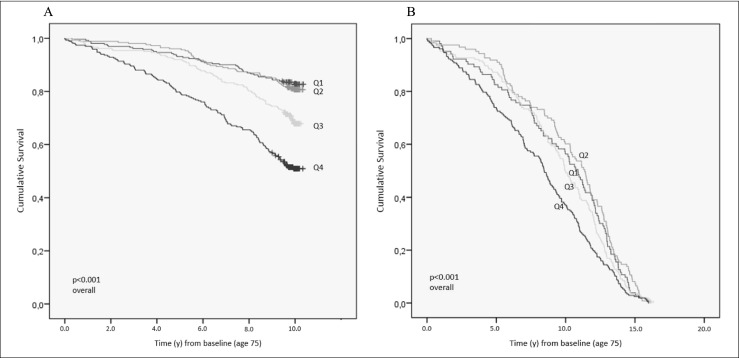
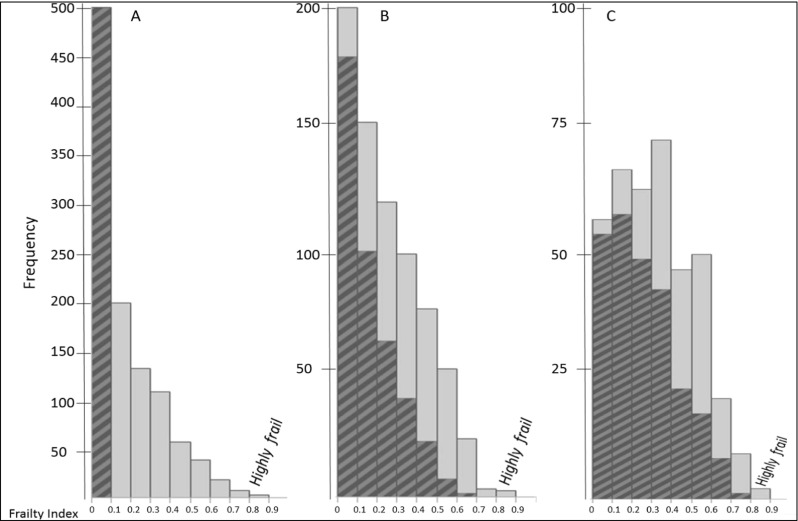
At baseline, the proportion least frail, i.e., most robust (FI 0.0-0.1) constituted 48%, dropping to 25 and 14% at age 80 and 85. On average, over 10 years, the annual linear frailty score progression was approximately 6-7%. Among the least frail, 11% remained robust over 10 years. A higher frailty score was equivalent to being 5 to 10 years older. Mortality was substantially higher in the highest quartile compared to the lowest based on baseline frailty score; after 10 years, 48.7% had died vs 17.2% (p = 1.7 × 10). Mortality risk over the first 5 years was highest in the frailest (Q4 vs Q1; HR 3.26 [1.86-5.73]; p < 0.001) and continued to be elevated at 10 years (HR 3.58 [2.55-5.03]; p < 0.001). Frailty was associated with BMD after adjusting for BMI (overall p = 0.006; Q1 vs Q4 p = 0.003).
The frailty index was highly predictive of mortality showing a threefold increased risk of death in the frailest both in a shorter and longer perspective. Only one in ten older women escaped progression after 10 years. Frailty and osteoporosis were associated.
了解基于人群的老年社区女性样本的衰弱分布情况、10 年内的衰弱进展情况以及与死亡率和骨质疏松症的关系。
本研究在一项旨在研究骨质疏松症的队列中进行。OPRA 队列由 75 岁的女性组成,基线时 n=1044 人,在 80 岁和 85 岁时进行随访。根据多个领域的健康缺陷创建了衰弱指数(得分范围为 0.0-1.0);结果是 15 年内的死亡率和股骨颈骨密度。
在基线时,最健康(FI 0.0-0.1)的比例最高(48%),在 80 岁和 85 岁时降至 25%和 14%。平均而言,在 10 年内,每年线性衰弱评分进展约为 6-7%。在最健康的人群中,11%的人在 10 年内仍然保持健康。较高的衰弱评分相当于年龄大 5-10 岁。根据基线衰弱评分,最高四分位的死亡率明显高于最低四分位;10 年后,48.7%的人死亡,而 17.2%(p=1.7×10)。在最脆弱的人群中(Q4 比 Q1;HR 3.26 [1.86-5.73];p<0.001),前 5 年的死亡率风险最高,并且在 10 年内仍保持升高(HR 3.58 [2.55-5.03];p<0.001)。在调整 BMI 后,衰弱与 BMD 相关(总体 p=0.006;Q1 比 Q4 p=0.003)。
衰弱指数对死亡率有很高的预测性,在较短和较长的时间内,最脆弱的人群死亡风险增加了三倍。只有十分之一的老年女性在 10 年后没有进展。衰弱和骨质疏松症相关。