The Generation R Study Group, Erasmus MC, University Medical Center Rotterdam, PO Box 2040, 3000 CA, Rotterdam, the Netherlands.
Department of Pediatrics, Sophia Children's Hospital, Erasmus MC, University Medical Center Rotterdam, Rotterdam, the Netherlands.
BMC Med. 2018 Nov 5;16(1):201. doi: 10.1186/s12916-018-1189-1.
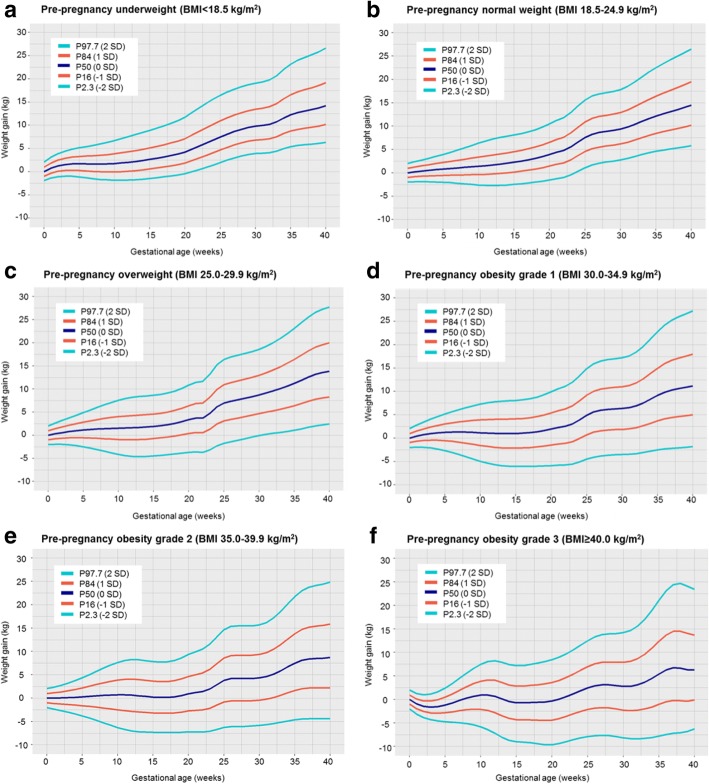
Gestational weight gain differs according to pre-pregnancy body mass index and is related to the risks of adverse maternal and child health outcomes. Gestational weight gain charts for women in different pre-pregnancy body mass index groups enable identification of women and offspring at risk for adverse health outcomes. We aimed to construct gestational weight gain reference charts for underweight, normal weight, overweight, and grades 1, 2 and 3 obese women and to compare these charts with those obtained in women with uncomplicated term pregnancies.
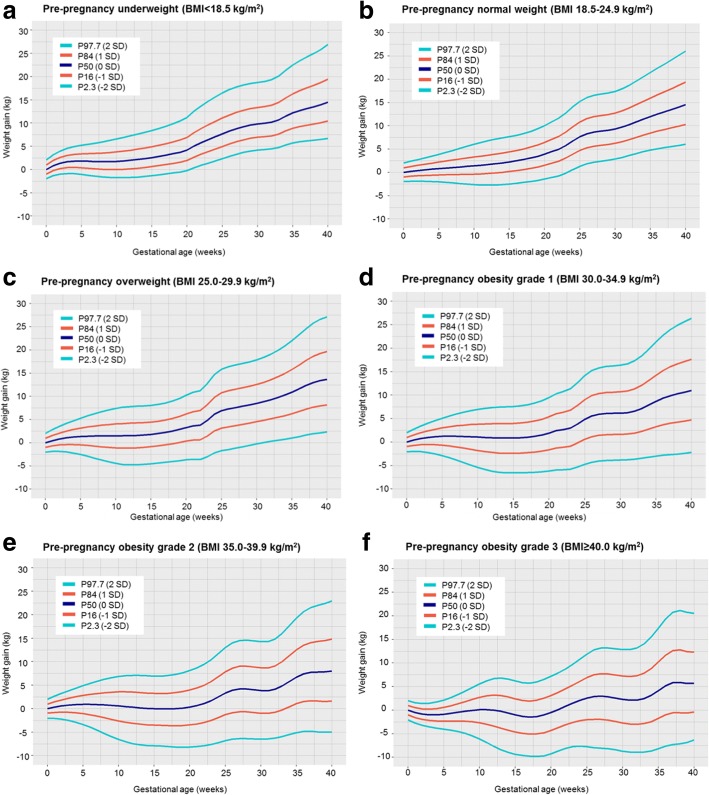
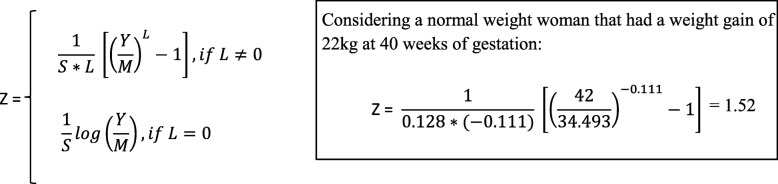
We used individual participant data from 218,216 pregnant women participating in 33 cohorts from Europe, North America, and Oceania. Of these women, 9065 (4.2%), 148,697 (68.1%), 42,678 (19.6%), 13,084 (6.0%), 3597 (1.6%), and 1095 (0.5%) were underweight, normal weight, overweight, and grades 1, 2, and 3 obese women, respectively. A total of 138, 517 women from 26 cohorts had pregnancies with no hypertensive or diabetic disorders and with term deliveries of appropriate for gestational age at birth infants. Gestational weight gain charts for underweight, normal weight, overweight, and grade 1, 2, and 3 obese women were derived by the Box-Cox t method using the generalized additive model for location, scale, and shape.
We observed that gestational weight gain strongly differed per maternal pre-pregnancy body mass index group. The median (interquartile range) gestational weight gain at 40 weeks was 14.2 kg (11.4-17.4) for underweight women, 14.5 kg (11.5-17.7) for normal weight women, 13.9 kg (10.1-17.9) for overweight women, and 11.2 kg (7.0-15.7), 8.7 kg (4.3-13.4) and 6.3 kg (1.9-11.1) for grades 1, 2, and 3 obese women, respectively. The rate of weight gain was lower in the first half than in the second half of pregnancy. No differences in the patterns of weight gain were observed between cohorts or countries. Similar weight gain patterns were observed in mothers without pregnancy complications.
Gestational weight gain patterns are strongly related to pre-pregnancy body mass index. The derived charts can be used to assess gestational weight gain in etiological research and as a monitoring tool for weight gain during pregnancy in clinical practice.
根据孕前体重指数的不同,孕期体重增加情况也有所不同,并且与母婴不良健康结局的风险相关。针对不同孕前体重指数组的女性制定孕期体重增加参考图表,有助于识别存在不良健康结局风险的女性及其后代。本研究旨在构建低体重、正常体重、超重和 1 级、2 级和 3 级肥胖女性的孕期体重增加参考图表,并与单纯足月妊娠女性的图表进行比较。
我们使用了来自欧洲、北美和大洋洲 33 个队列的 218216 名孕妇的个体参与者数据。其中,9065 名(4.2%)、148697 名(68.1%)、42678 名(19.6%)、13084 名(6.0%)、3597 名(1.6%)和 1095 名(0.5%)分别为低体重、正常体重、超重和 1 级、2 级和 3 级肥胖女性。共有 138517 名来自 26 个队列的女性,她们的妊娠没有高血压或糖尿病等并发症,并且足月分娩的婴儿为适于胎龄儿。采用 Box-Cox t 法,通过广义加性模型进行位置、尺度和形状的估计,为低体重、正常体重、超重和 1 级、2 级和 3 级肥胖女性分别构建了孕期体重增加图表。
我们发现,孕期体重增加因产妇的孕前体重指数组而异。40 周时,低体重女性的中位(四分位间距)孕期体重增加为 14.2kg(11.4-17.4kg),正常体重女性为 14.5kg(11.5-17.7kg),超重女性为 13.9kg(10.1-17.9kg),而 1 级、2 级和 3 级肥胖女性的体重增加中位数分别为 11.2kg(7.0-15.7kg)、8.7kg(4.3-13.4kg)和 6.3kg(1.9-11.1kg)。体重增加在妊娠前半段较慢,在后半段较快。不同队列或国家之间的体重增加模式没有差异。在没有妊娠并发症的母亲中,也观察到了类似的体重增加模式。
孕期体重增加模式与孕前体重指数密切相关。所构建的图表可用于病因研究中的孕期体重增加评估,并作为临床实践中孕期体重增加的监测工具。