Na Xu, Guo Haihong, Zhang Yu, Shen Liu, Wu Sizhu, Li Jiao
Institute of Medical Information / Medical Library, Chinese Academy of Medical Sciences & Peking Union Medical College, Beijing, China.
J Med Internet Res. 2018 Nov 30;20(11):e11655. doi: 10.2196/11655.
The financial relationship between physicians and industries has become a hotly debated issue globally. The Physician Payments Sunshine Act of the US Affordable Care Act (2010) promoted transparency of the transactions between industries and physicians by making remuneration data publicly accessible in the Open Payments Program database. Meanwhile, according to the World Health Organization, the majority of all noncommunicable disease deaths were caused by cardiovascular disease.
This study aimed to investigate the distribution of non-research and non-ownership payments made to thoracic surgeons, to explore the regularity of financial relationships between industries and thoracic surgeons.
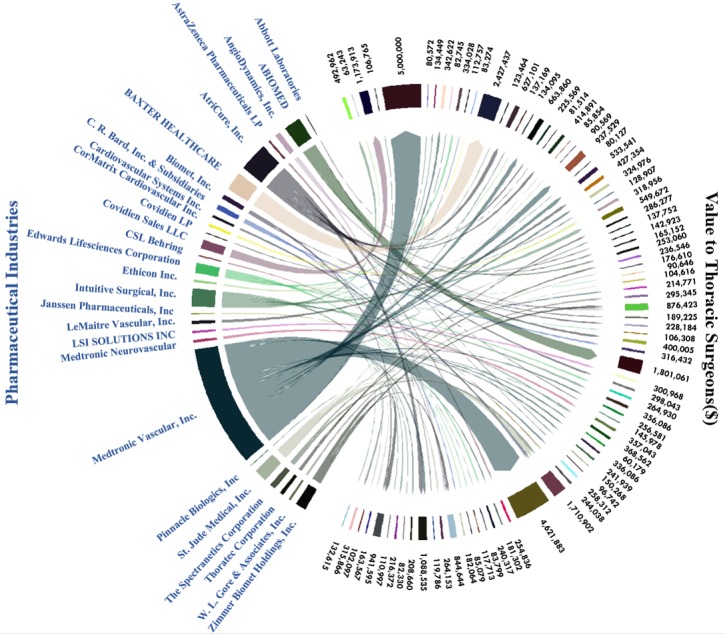
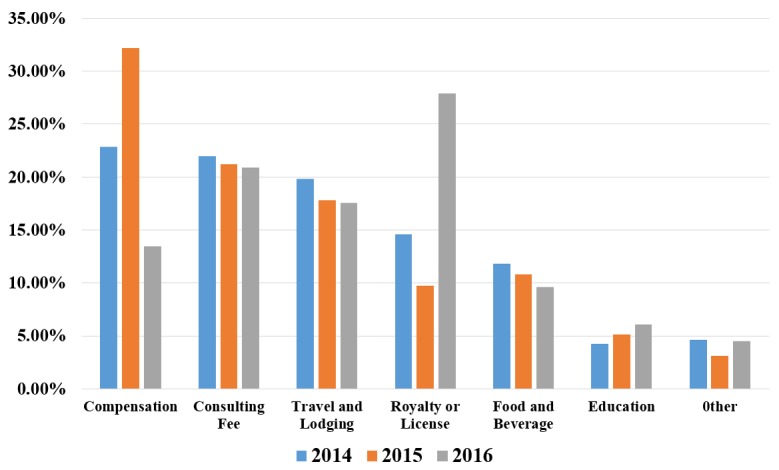
Annual statistical data were obtained from the Open Payments Program general payment dataset from 2014-2016. We characterized the distribution of annual payments with single payment transactions greater than US $10,000, quantified the major expense categories (eg, Compensation, Consulting Fees, Travel and Lodging), and identified the 30 highest-paying industries. Moreover, we drew out the financial relations between industries to thoracic surgeons using chord diagram visualization.
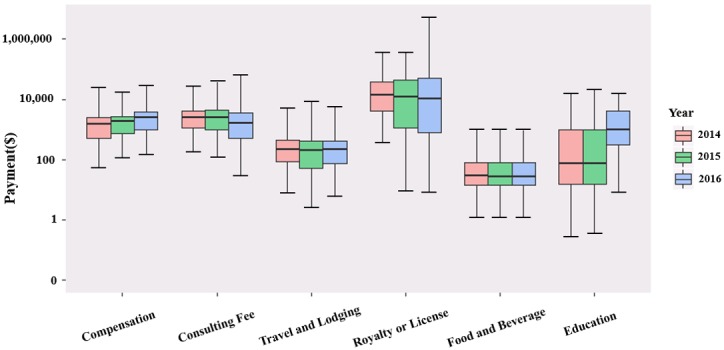
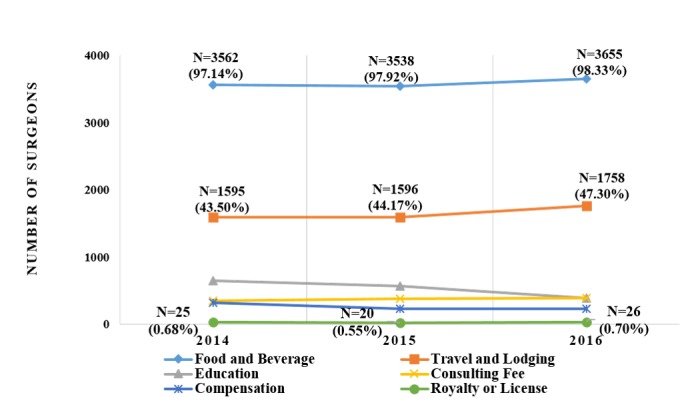
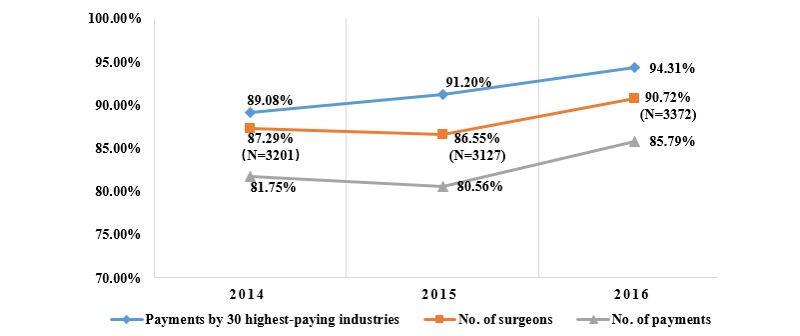
The three highest categories with single payments greater than US $10,000 were Royalty or License, Compensation, and Consulting Fees. Payments related to Royalty or License transferred from only 5.38% of industries to 0.75% of surgeons with the highest median (US $13,753, $11,992, and $10,614 respectively) in 3-year period. In contrast, payments related to Food and Beverage transferred from 93.50% of industries to 98.48% of surgeons with the lowest median (US $28, $27, and $27). The top 30 highest-paying industries made up approximately 90% of the total payments (US $21,036,972, $23,304,996, and $28,116,336). Furthermore, just under 9% of surgeons received approximately 80% of the total payments in each of the 3 years. Specifically, the 100 highest cumulative payments, accounting for 52.69% of the total, transferred from 27 (6.05%) pharmaceutical industries to 86 (1.89%) thoracic surgeons from 2014-2016; 7 surgeons received payments greater than US $1,000,000; 12 surgeons received payments greater than US $400,000. The majority (90%) of these surgeons received tremendous value from only one industry.
There exists a great discrepancy in the distribution of payments by categories. Royalty or License Fees, Compensation, and Consulting Fees are the primary transferring channels of single large payments. The massive transfer from industries to surgeons has a strong "apical dominance" and excludability. Further research should focus on discovering the fundamental driving factors for the strong concentration of certain medical devices and how these payments will affect the industry itself.
医生与行业之间的财务关系已成为全球热议的话题。美国《平价医疗法案》(2010年)中的《医生薪酬阳光法案》通过使薪酬数据在“公开支付计划”数据库中公开可查,促进了行业与医生之间交易的透明度。与此同时,据世界卫生组织称,所有非传染性疾病死亡的大多数是由心血管疾病导致的。
本研究旨在调查支付给胸外科医生的非研究和非所有权款项的分布情况,探索行业与胸外科医生之间财务关系的规律。
从“公开支付计划”一般支付数据集获取2014 - 2016年的年度统计数据。我们对单笔支付超过10,000美元的年度支付分布进行了特征描述,量化了主要费用类别(如薪酬、咨询费、差旅费和住宿费),并确定了支付最高的30个行业。此外,我们使用弦图可视化展示了行业与胸外科医生之间的财务关系。
单笔支付超过10,000美元的三大最高类别是特许权使用费或许可费、薪酬和咨询费。与特许权使用费或许可费相关的支付在3年期间仅从5.38%的行业转移到0.75%的外科医生,中位数最高(分别为13,753美元、11,992美元和10,614美元)。相比之下,与食品和饮料相关的支付从93.50%的行业转移到98.48%的外科医生,中位数最低(分别为28美元、27美元和27美元)。支付最高的前30个行业约占总支付的90%(分别为21,036,972美元、23,304,996美元和28,116,336美元)。此外,在这3年中的每一年,不到9%的外科医生获得了约80%的总支付。具体而言,从各行业累计支付最高的100笔款项,占总数的52.69%,在2014 - 2016年期间从27个(6.05%)制药行业转移到86个(1.89%)胸外科医生;7名外科医生获得的支付超过1,000,000美元;12名外科医生获得的支付超过400,000美元。这些外科医生中的大多数(90%)仅从一个行业获得了巨额款项。
各类别支付分布存在巨大差异。特许权使用费或许可费、薪酬和咨询费是单笔大额支付的主要转移渠道。从行业到外科医生的大量转移具有强烈的“顶端优势”和排他性。进一步的研究应侧重于发现某些医疗设备高度集中的根本驱动因素以及这些支付将如何影响行业本身。