Gunaid Abdallah Ahmed, Al-Kebsi Mohammed Mohammed, Bamashmus Mahfouth Abdalla, Al-Akily Saleh Ahmed, Al-Radaei Ahmed Nasser
Department of Internal Medicine, Sana'a University Medical School, Sana'a, Yemen.
Department of Ophthalmology, Sana'a University Medical School, Sana'a, Yemen.
BMJ Open Diabetes Res Care. 2018 Dec 7;6(1):e000587. doi: 10.1136/bmjdrc-2018-000587. eCollection 2018.
To identify clinical phenotypes of type 2 diabetes (T2D) among adults presenting with a first diagnosis of diabetes.
A total of 500 consecutive patients were subject to clinical assessment and laboratory investigations. We used data-driven cluster analysis to identify phenotypes of T2D based on clinical variables and Homeostasis Model Assessment (HOMA2) of insulin sensitivity and beta-cell function estimated from paired fasting blood glucose and specific insulin levels.
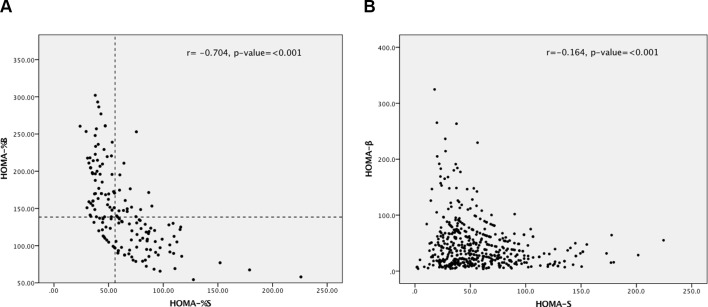
The cluster analysis identified three statistically different clusters: cluster 1 (high insulin resistance and high beta-cell function group), which included patients with low insulin sensitivity and high beta-cell function; cluster 2 (low insulin resistance and low beta-cell function group), which included patients with high insulin sensitivity but very low beta-cell function; and cluster 3 (high insulin resistance and low beta-cell function group), which included patients with low insulin sensitivity and low beta-cell function. Insulin sensitivity, defined as median HOMA2-S, was progressively increasing from cluster 1 (35.4) to cluster 3 (40.9), to cluster 2 (76) (p<0.001). On the contrary, beta-cell function, defined as median HOMA2-β, was progressively declining from cluster 1 (78.3) to cluster 3 (30), to cluster 2 (22.3) (p<0.001). Clinical and biomarker variables associated with insulin resistance like obesity, abdominal adiposity, fatty liver, and high serum triglycerides were mainly seen in clusters 1 and 3. The highest median hemoglobin A1c value was noted in cluster 2 (88 mmol/mol) and the lowest in cluster 1.
Cluster analysis of newly diagnosed T2D in adults has identified three phenotypes based on clinical variables central to the development of diabetes and on specific clinical variables of each phenotype.
确定首次诊断为糖尿病的成年人中2型糖尿病(T2D)的临床表型。
共对500例连续患者进行了临床评估和实验室检查。我们使用数据驱动的聚类分析,根据临床变量以及基于配对空腹血糖和特定胰岛素水平估算的胰岛素敏感性和β细胞功能的稳态模型评估(HOMA2)来确定T2D的表型。
聚类分析确定了三个统计学上不同的聚类:聚类1(高胰岛素抵抗和高β细胞功能组),包括胰岛素敏感性低但β细胞功能高的患者;聚类2(低胰岛素抵抗和低β细胞功能组),包括胰岛素敏感性高但β细胞功能极低的患者;聚类3(高胰岛素抵抗和低β细胞功能组),包括胰岛素敏感性低且β细胞功能低的患者。胰岛素敏感性定义为HOMA2-S中位数,从聚类1(35.4)到聚类3(40.9)再到聚类2(76)逐渐增加(p<0.001)。相反,β细胞功能定义为HOMA2-β中位数,从聚类1(78.3)到聚类3(30)再到聚类2(22.3)逐渐下降(p<0.001)。与胰岛素抵抗相关的临床和生物标志物变量,如肥胖、腹部肥胖、脂肪肝和高血清甘油三酯,主要出现在聚类1和聚类3中。聚类2的血红蛋白A1c中位数最高(88 mmol/mol),聚类1最低。
对成年人新诊断的T2D进行聚类分析,已根据糖尿病发展的核心临床变量以及每种表型的特定临床变量确定了三种表型。