Lemmens Veerle, Ramanathan Keerthana, Hendrix Jelle
Hasselt University, Advanced Optical Microscopy Centre and Biomedical Research Institute, Dynamic Bioimaging Lab, Diepenbeek, Belgium.
Data Brief. 2020 Feb 28;29:105348. doi: 10.1016/j.dib.2020.105348. eCollection 2020 Apr.
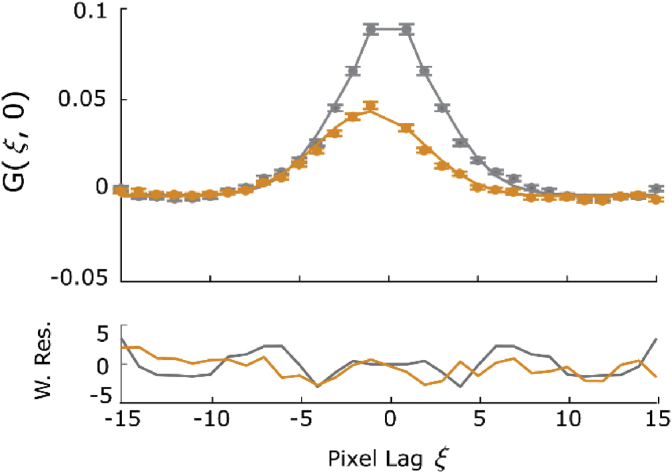
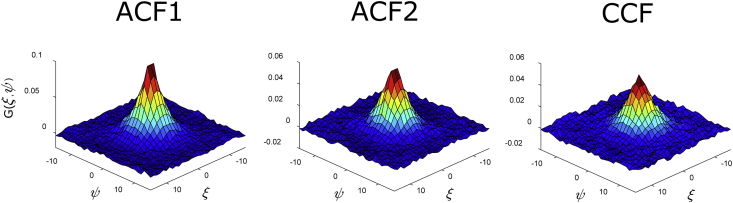
The data provided with this paper are image series of slowly diffusing GlyRa3 molecules, linked to either eGFP or mCherry fluorescent proteins, at the membrane of HEK cells, acquired on a Zeiss LSM880 confocal laser scanning microscope. Raster spectral image cross-correlation spectroscopy (RSICS) is applied to the data, a technique that exploits intensity fluctuations in confocal image series recorded using a spectral detector to study the diffusion and concentration of molecules, and interactions between them. First, spectral filters are created from reference image series containing GlyRa3 labeled with a single fluorophore. Once experimental data containing GlyRa3 labeled with both fluorophores is acquired, single images are either autocorrelated, or the cross-correlation is calculated between two images, each one containing the data for eGFP or mCherry labeled GyRa 3. Data is then fit with a one-component model assuming a two-dimensional Gaussian point spread function to obtain the diffusion coefficient, , and average number of molecules in the focus, . The software package PAM is used to analyze all the acquired data. The data can be used as a reference for artifact-free two-color ccRICS that contains slowly diffusing interacting molecules. Additionally, the analysis workflow described in this paper helps researchers avoid common errors during a RICS experiment.
本文所提供的数据是在蔡司LSM880共聚焦激光扫描显微镜上采集的、与eGFP或mCherry荧光蛋白相连的缓慢扩散的GlyRa3分子在HEK细胞膜上的图像序列。将光栅光谱图像互相关光谱法(RSICS)应用于这些数据,该技术利用使用光谱探测器记录的共聚焦图像序列中的强度波动来研究分子的扩散、浓度及其之间的相互作用。首先,从包含用单一荧光团标记的GlyRa3的参考图像序列创建光谱滤波器。一旦获取了包含用两种荧光团标记的GlyRa3的实验数据,就对单幅图像进行自相关分析,或者计算两幅图像之间的互相关,每幅图像包含eGFP或mCherry标记的GyRa 3的数据。然后,假设二维高斯点扩散函数,用单组分模型对数据进行拟合,以获得扩散系数 和焦点处分子的平均数 。使用软件包PAM分析所有采集的数据。这些数据可作为包含缓慢扩散的相互作用分子的无伪影双色ccRICS的参考。此外,本文所述的分析工作流程有助于研究人员在RICS实验中避免常见错误。