From the Department of Radiology, University of New Mexico, 3004 La Mancha Dr NW, Albuquerque, NM 87104 (F.A.M.); Department of Radiology and Radiological Sciences, Johns Hopkins University School of Medicine, Baltimore, Md (M.M.); Department for Quality and Safety, American College of Radiology, Reston, Va (M.B.C.); Departments of Radiology and Medicine, Penn State Hershey Medical Center, Hershey, Pa (C.E.C.); Radiation Section, Louisiana Department of Environmental Quality, West Monroe, La (J.G.E.); Department of Radiology, Stanford University, Stanford, Calif (D.P.F.); Center for Devices and Radiological Health, U.S. Food and Drug Administration, Silver Spring, Md (D.L.M., D.C.S.); Mallinckrodt Institute of Radiology, Washington University School of Medicine, St Louis, Mo (H.D.R.); Department of Radiation Oncology, University of Rochester, Rochester, NY (M.T.M.); Radiation Studies Section, U.S. Centers for Disease Control and Prevention (CDC), Atlanta, Ga (A.J.A.); Crayton Pruitt Family Department of Biomedical Engineering, University of Florida, Gainesville, Fla (W.E.B.); Department of Radiology, Logan University, Maryland Heights, Mo (G.M.G.); Duke University, U.S. Department of Veterans Affairs, Durham, NC (R.H.S.); Rollins School of Public Health, Emory University, Atlanta, Ga (J.M.S.); and Mayo Clinic, Rochester, Minn (R.J.V.).
Radiology. 2020 May;295(2):418-427. doi: 10.1148/radiol.2020192256. Epub 2020 Mar 17.
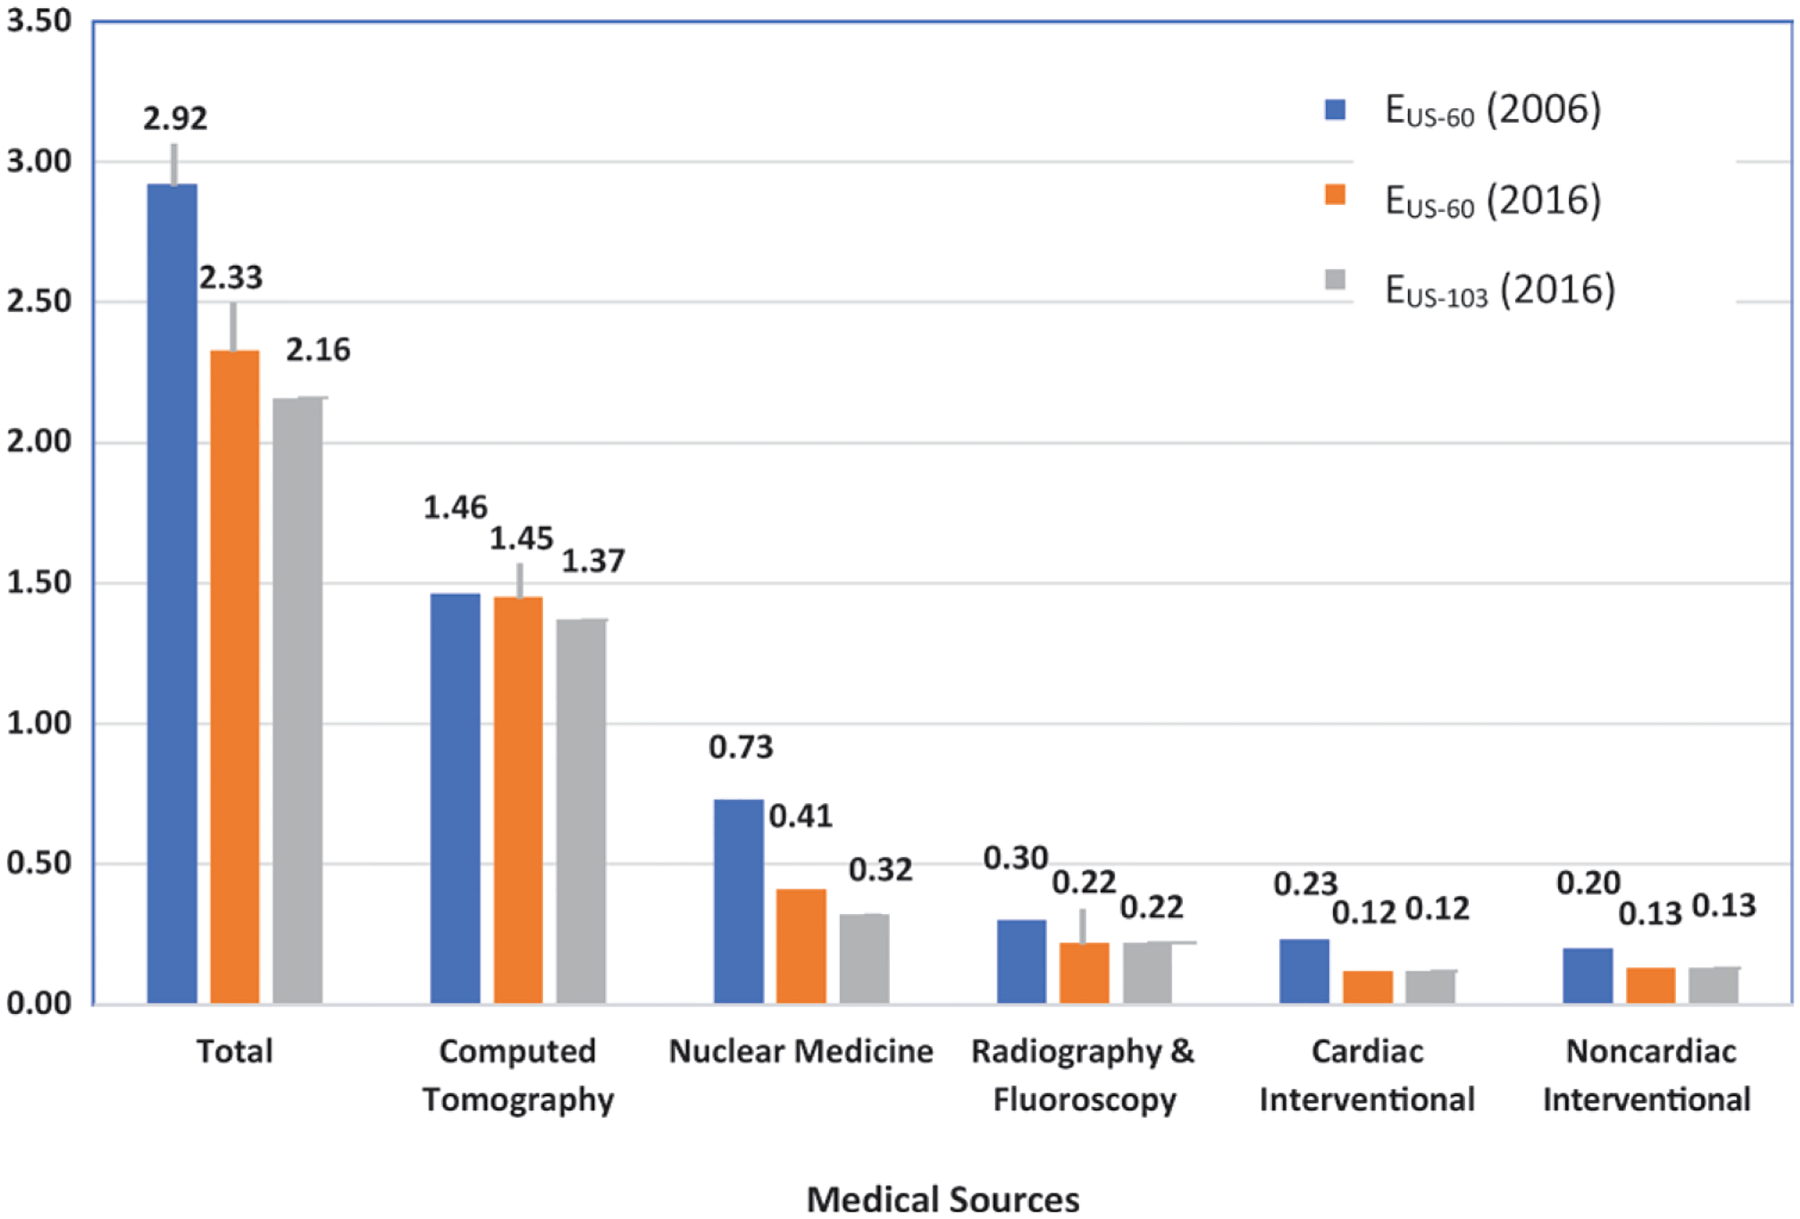
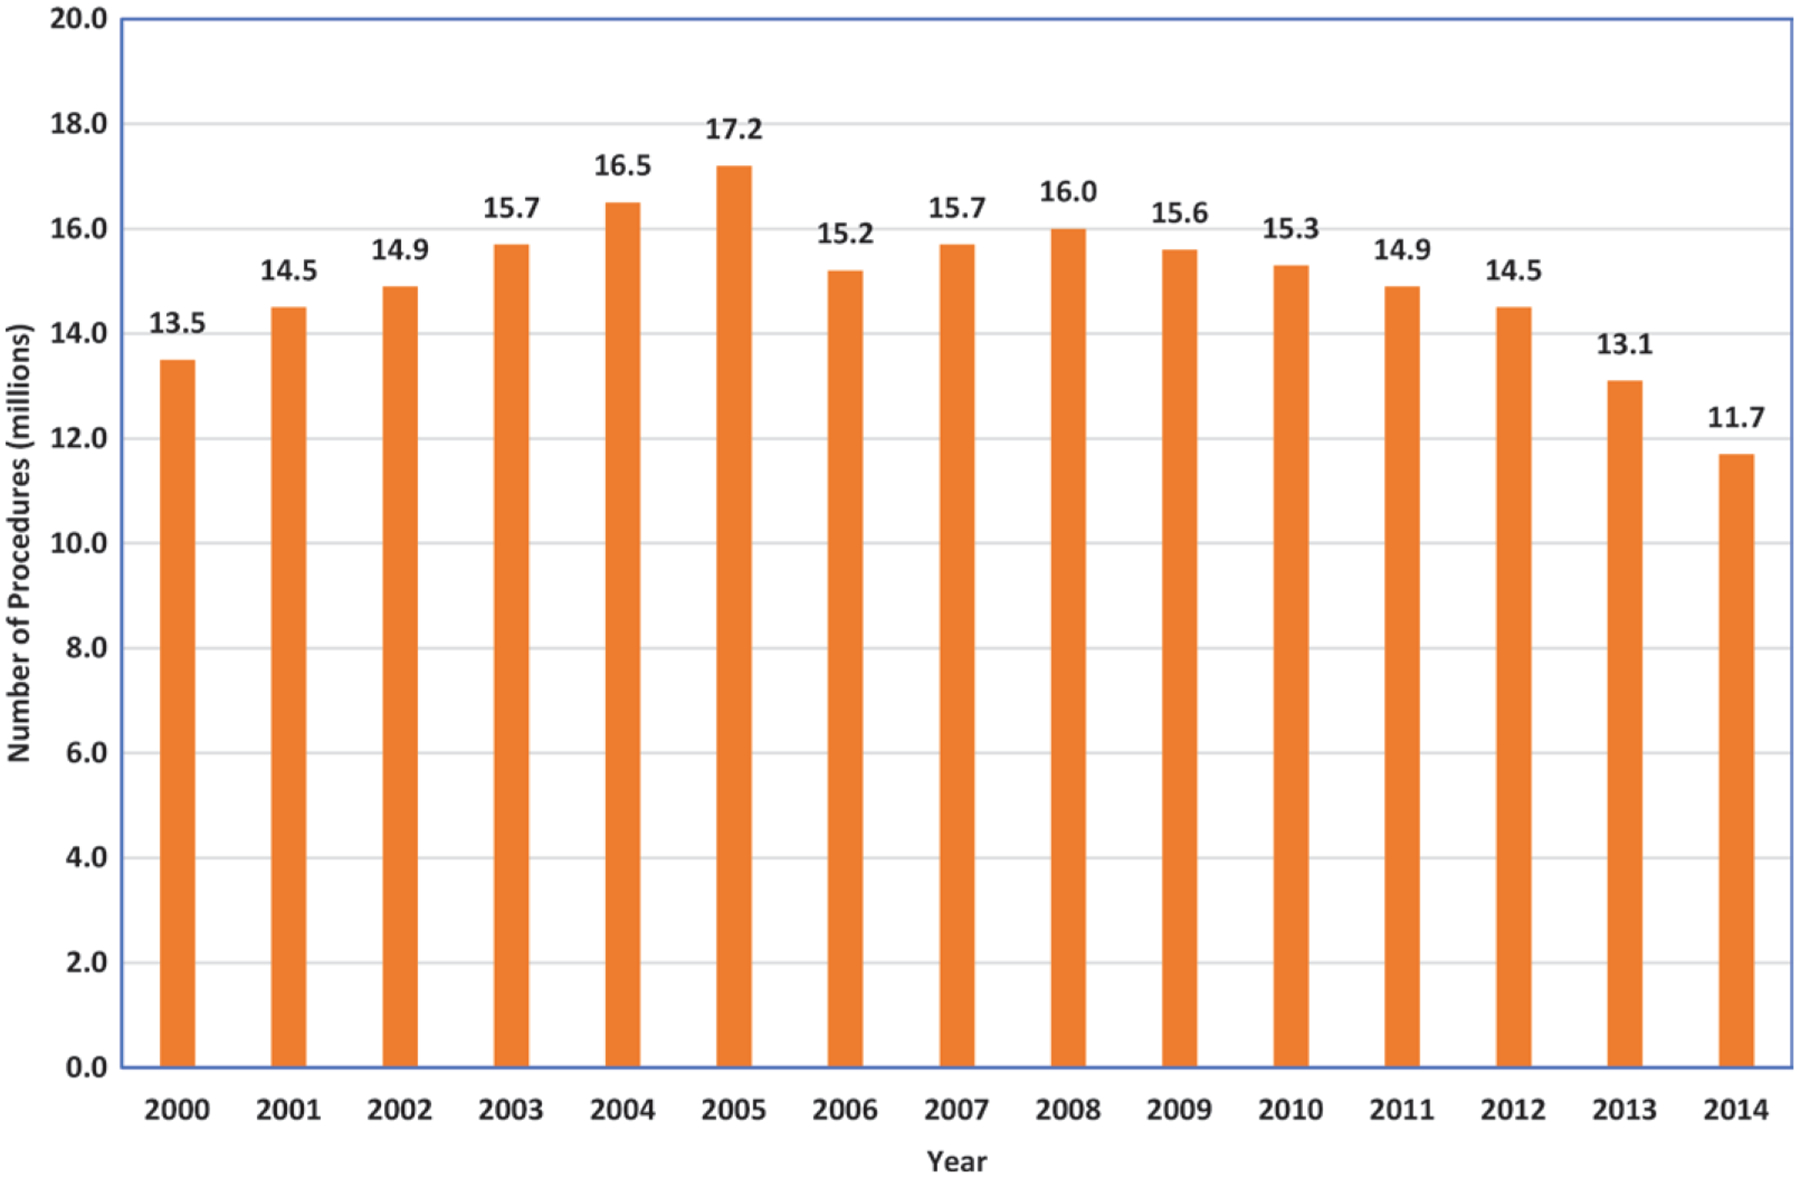
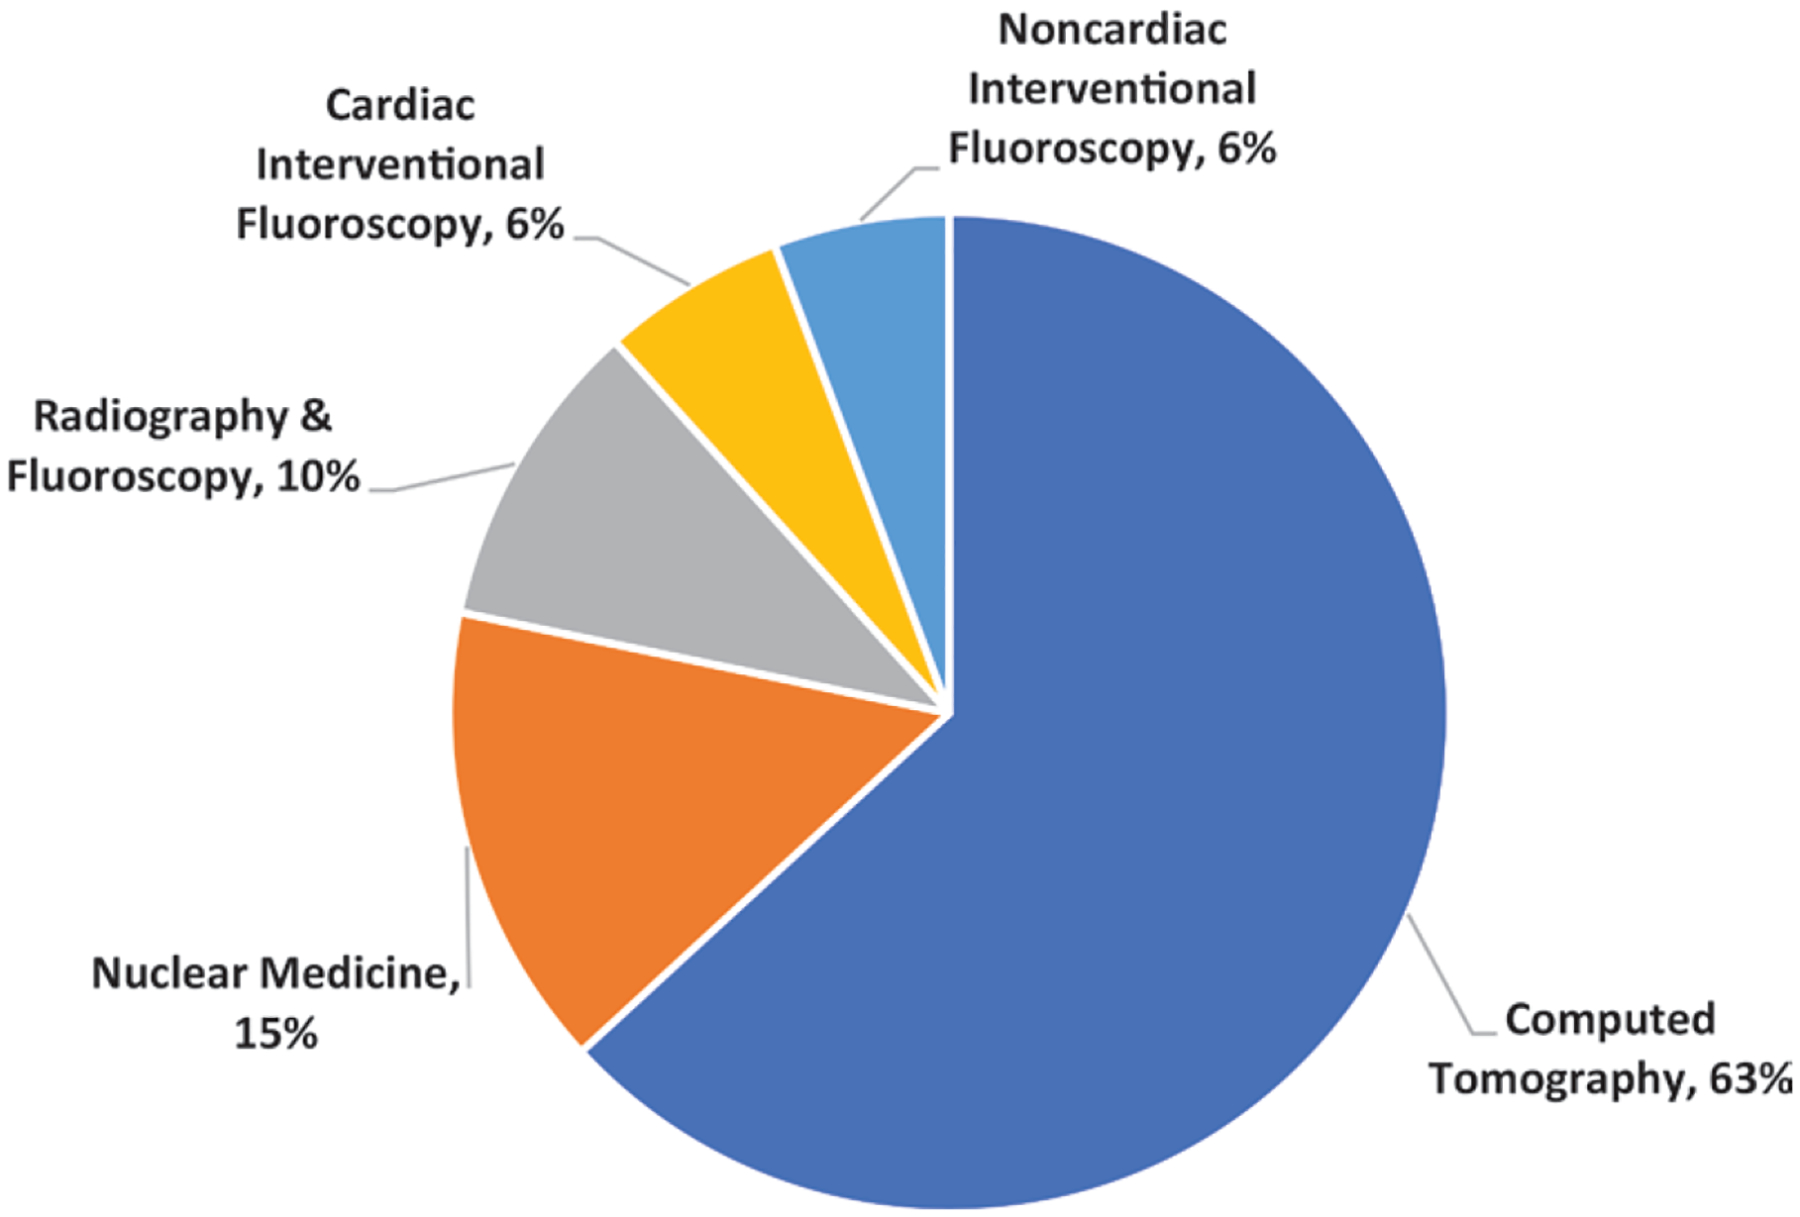
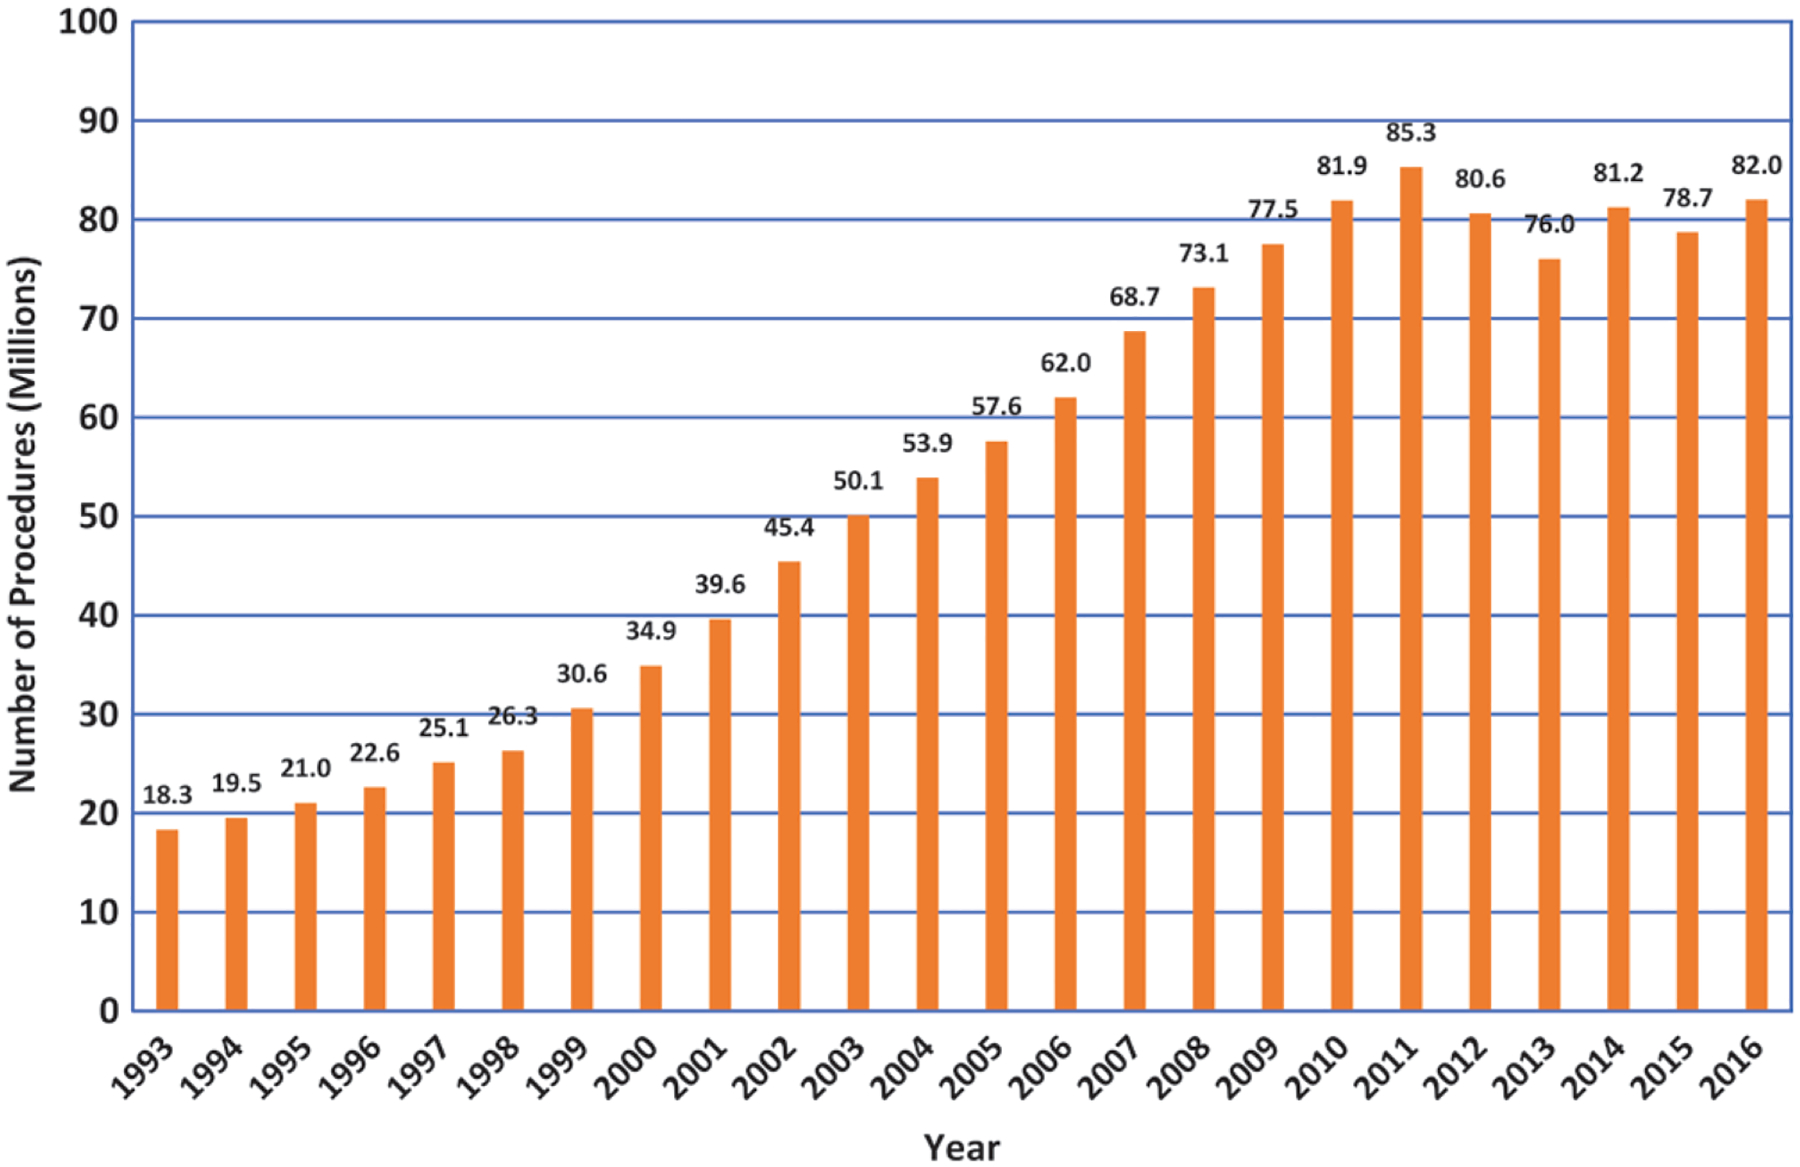
Background Comprehensive assessments of the frequency and associated doses from radiologic and nuclear medicine procedures are rarely conducted. The use of these procedures and the population-based radiation dose increased remarkably from 1980 to 2006. Purpose To determine the change in per capita radiation exposure in the United States from 2006 to 2016. Materials and Methods The U.S. National Council on Radiation Protection and Measurements conducted a retrospective assessment for 2016 and compared the results to previously published data for the year 2006. Effective dose values for procedures were obtained from the literature, and frequency data were obtained from commercial, governmental, and professional society data. Results In the United States in 2006, an estimated 377 million diagnostic and interventional radiologic examinations were performed. This value remained essentially the same for 2016 even though the U.S. population had increased by about 24 million people. The number of CT scans performed increased from 67 million to 84 million, but the number of other procedures (eg, diagnostic fluoroscopy) and nuclear medicine procedures decreased from 17 million to 13.5 million. The number of dental radiographic and dental CT examinations performed was estimated to be about 320 million in 2016. Using the tissue-weighting factors from Publication 60 of the International Commission on Radiological Protection, the U.S. annual individual (per capita) effective dose from diagnostic and interventional medical procedures was estimated to have been 2.9 mSv in 2006 and 2.3 mSv in 2016, with the collective doses being 885 000 and 755 000 person-sievert, respectively. Conclusion The trend from 1980 to 2006 of increasing dose from medical radiation has reversed. Estimated 2016 total collective effective dose and radiation dose per capita dose are lower than in 2006. © RSNA, 2020 See also the editorial by Einstein in this issue.
背景 对放射学和核医学程序的频率及其相关剂量进行全面评估很少进行。自 1980 年至 2006 年,这些程序的使用和基于人群的辐射剂量显著增加。
目的 确定 2006 年至 2016 年美国人均辐射暴露量的变化。
材料与方法 美国国家辐射防护与测量委员会对 2016 年进行了回顾性评估,并将结果与之前发表的 2006 年数据进行了比较。从文献中获得程序的有效剂量值,并从商业、政府和专业协会数据中获得频率数据。
结果 2006 年,美国估计进行了 3.77 亿次诊断性和介入性放射学检查。尽管美国人口增加了约 2400 万人,但这一数字在 2016 年基本保持不变。CT 扫描量从 6700 万增加到 8400 万,但其他程序(如诊断性透视)和核医学程序的数量从 1700 万减少到 1350 万。2016 年,牙科放射照相和牙科 CT 检查的数量估计约为 3.2 亿次。使用国际辐射防护委员会第 60 号出版物中的组织权重因子,美国诊断和介入性医疗程序的个体(人均)年有效剂量估计在 2006 年为 2.9 mSv,在 2016 年为 2.3 mSv,相应的集体剂量分别为 88.5 万和 75.5 万人·Sv。
结论 自 1980 年至 2006 年,医疗辐射剂量增加的趋势已经逆转。估计 2016 年的总集体有效剂量和人均剂量均低于 2006 年。
版权所有©2020 美国放射学会。参见本期 Einstein 社论。