• 文献检索
  • 文档翻译
  • 深度研究
  • 学术资讯
  • Suppr Zotero 插件Zotero 插件
  • 邀请有礼
  • 套餐&价格
  • 历史记录
应用&插件
Suppr Zotero 插件Zotero 插件浏览器插件Mac 客户端Windows 客户端微信小程序
定价
高级版会员购买积分包购买API积分包
服务
文献检索文档翻译深度研究API 文档MCP 服务
关于我们
关于 Suppr公司介绍联系我们用户协议隐私条款
关注我们

Suppr 超能文献

核心技术专利:CN118964589B侵权必究
粤ICP备2023148730 号-1Suppr @ 2026

文献检索

告别复杂PubMed语法,用中文像聊天一样搜索,搜遍4000万医学文献。AI智能推荐,让科研检索更轻松。

立即免费搜索

文件翻译

保留排版,准确专业,支持PDF/Word/PPT等文件格式,支持 12+语言互译。

免费翻译文档

深度研究

AI帮你快速写综述,25分钟生成高质量综述,智能提取关键信息,辅助科研写作。

立即免费体验

逆拉普拉斯变换和 T2 弛豫测量数据的多指数拟合分析:含水溶液和脂肪样本的水模研究。

Inverse Laplace transform and multiexponential fitting analysis of T2 relaxometry data: a phantom study with aqueous and fat containing samples.

机构信息

Foundation for Research and Technology-Hellas (FORTH), Institute of Computer Science (ICS), Computational Bio-Medicine Laboratory (CBML), N.Plastira 100, Vassilika Vouton, Heraklion, GR-70013, Crete, Greece.

School of Medicine, University of Crete, Heraklion, Greece.

出版信息

Eur Radiol Exp. 2020 May 7;4(1):28. doi: 10.1186/s41747-020-00154-5.

DOI:10.1186/s41747-020-00154-5
PMID:32378090
原文链接:https://pmc.ncbi.nlm.nih.gov/articles/PMC7203287/
Abstract

BACKGROUND

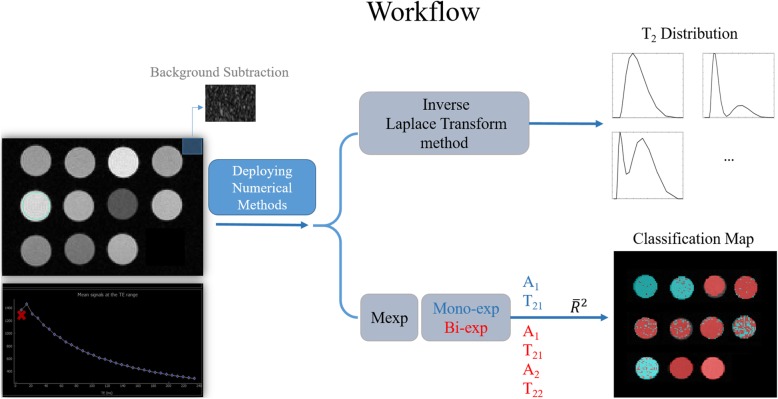
The inverse Laplace transform (ILT) is the most widely used method for T2 relaxometry data analysis. This study examines the qualitative agreement of ILT and a proposed multiexponential (Mexp method) regarding the number of T2 components. We performed a feasibility study for the voxelwise characterisation of heterogeneous tissue with T2 relaxometry.

METHODS

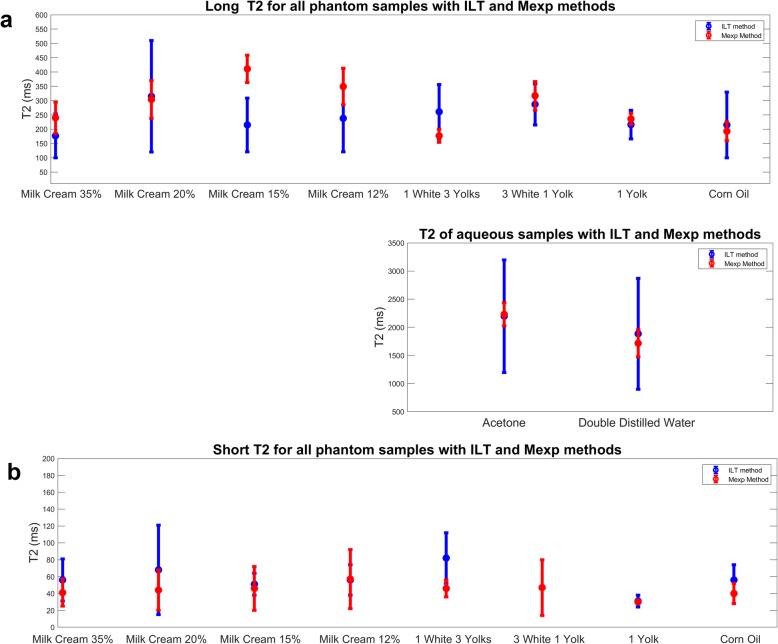
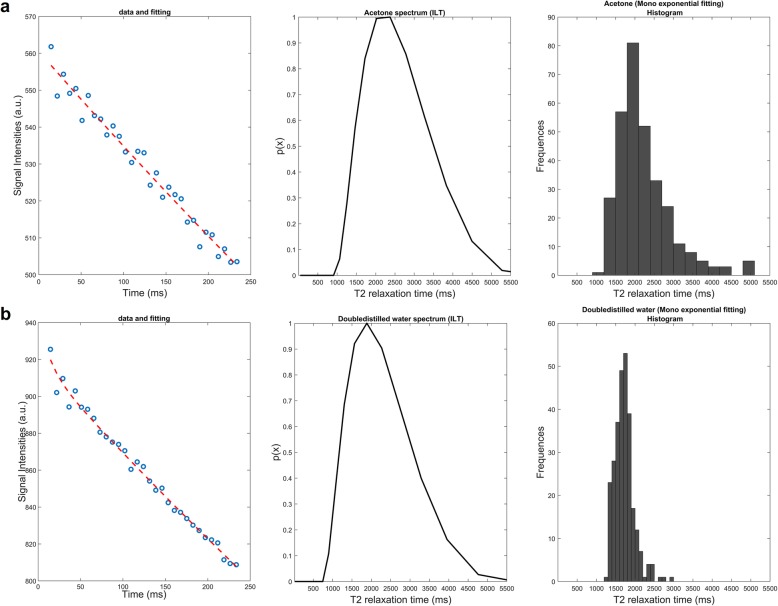
Eleven samples of aqueous, fatty and mixed composition were analysed using ILT and Mexp. The phantom was imaged using a 1.5-T system with a single slice T2 relaxometry 25-echo Carr-Purcell-Meiboom-Gill sequence in order to obtain the T2 decay curve with 25 equidistant echo times. The adjusted R goodness of fit criterion was used to determine the number of T2 components using the Mexp method on a voxel-based analysis. Comparison of mean and standard deviation of T2 values for both methods was performed by fitting a Gaussian function to the ILT resulting vector.

RESULTS

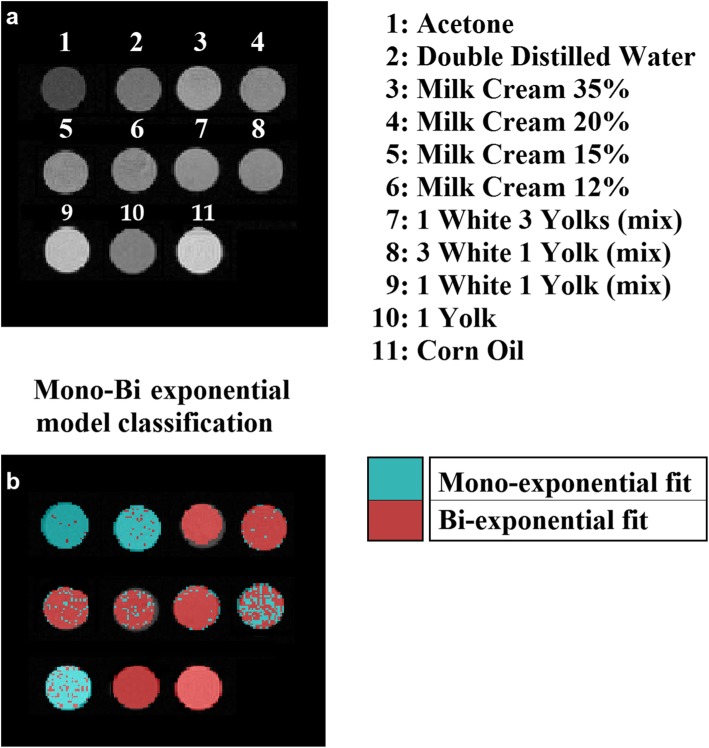
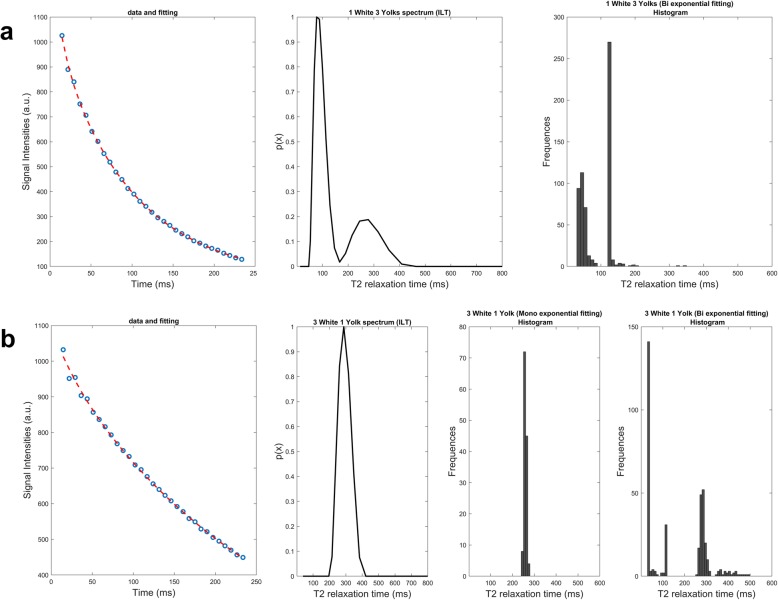
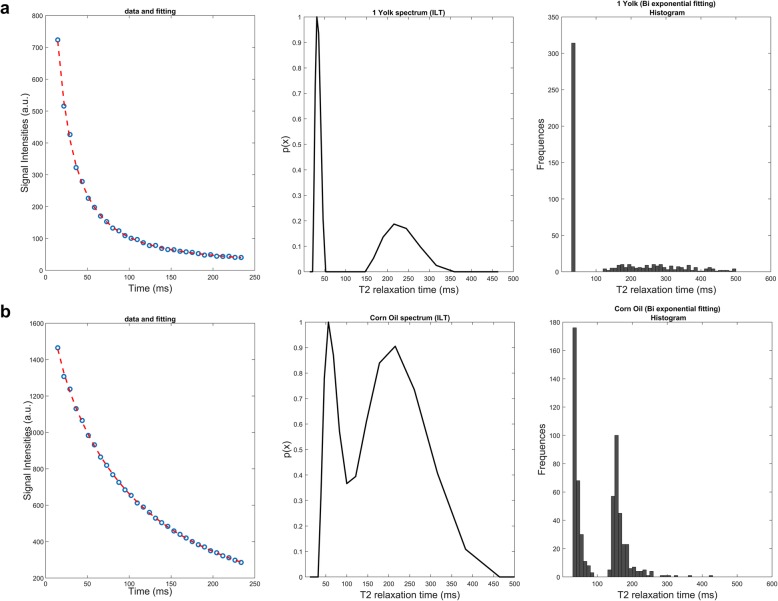
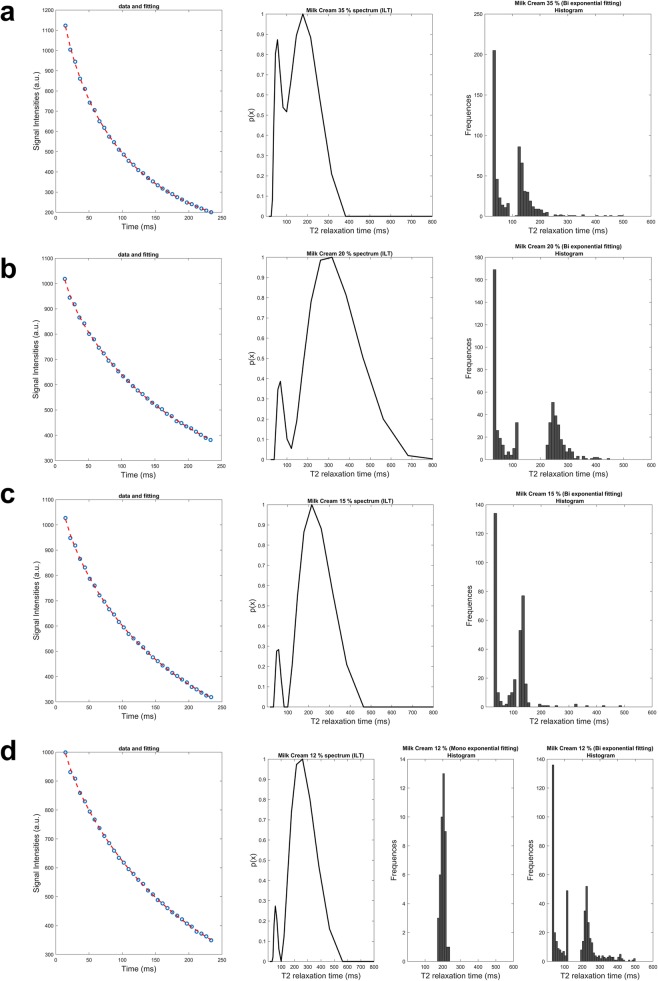
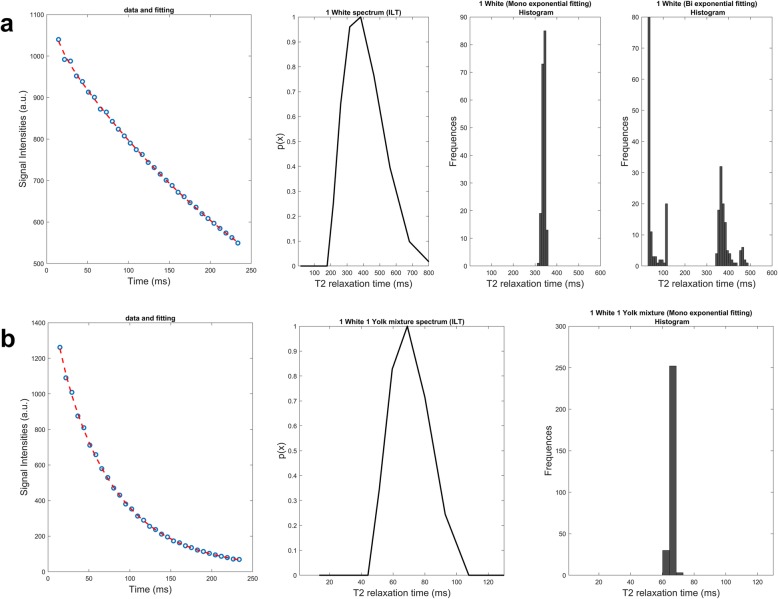
Phantom results showed pure monoexponential decay for acetone and water and pure biexponential behaviour for corn oil, egg yolk, and 35% fat milk cream, while mixtures of egg whites and yolks as well as milk creams with 12-20% fatty composition exhibit mixed monoexponential and biexponential behaviour at different fractions. The number of T2 components by the Mexp method was compared to the ILT-derived spectrum as ground truth.

CONCLUSIONS

Mexp analysis with the adjusted R criterion can be used for the detection of the T2 distribution of aqueous, fatty and mixed samples with the added advantage of voxelwise mapping.

摘要

背景

逆拉普拉斯变换(ILT)是 T2 弛豫数据分析中最广泛使用的方法。本研究检查了 ILT 和拟议的多指数(Mexp 方法)在 T2 分量数量方面的定性一致性。我们对 T2 弛豫法对异质组织的体素特征进行了可行性研究。

方法

使用 ILT 和 Mexp 分析了 11 种水相、脂肪相和混合组成的样品。使用 1.5-T 系统对幻影进行成像,采用单切片 T2 弛豫 25 回波 Carr-Purcell-Meiboom-Gill 序列,以便用 25 个等距回波时间获得 T2 衰减曲线。在体素基础分析上,使用 Mexp 方法通过调整 R 拟合优度标准确定 T2 分量的数量。通过拟合高斯函数对 ILT 结果向量进行拟合,比较两种方法的 T2 值的平均值和标准偏差。

结果

幻影结果表明丙酮和水为纯单指数衰减,玉米油、蛋黄和 35%脂肪牛奶奶油为纯双指数行为,而蛋清和蛋黄混合物以及脂肪含量为 12-20%的牛奶奶油则表现出不同分数的混合单指数和双指数行为。通过 Mexp 方法获得的 T2 分量数量与 ILT 衍生光谱作为基准进行比较。

结论

调整后的 R 标准的 Mexp 分析可用于检测水相、脂肪相和混合样品的 T2 分布,其优点是体素映射。

https://cdn.ncbi.nlm.nih.gov/pmc/blobs/14a0/7203287/d78f1ea6c4c4/41747_2020_154_Fig8_HTML.jpg
https://cdn.ncbi.nlm.nih.gov/pmc/blobs/14a0/7203287/a3a5ac710658/41747_2020_154_Fig1_HTML.jpg
https://cdn.ncbi.nlm.nih.gov/pmc/blobs/14a0/7203287/9bcb7d17d667/41747_2020_154_Fig2_HTML.jpg
https://cdn.ncbi.nlm.nih.gov/pmc/blobs/14a0/7203287/3d0c7bb827be/41747_2020_154_Fig3_HTML.jpg
https://cdn.ncbi.nlm.nih.gov/pmc/blobs/14a0/7203287/2b9ebcd73d85/41747_2020_154_Fig4_HTML.jpg
https://cdn.ncbi.nlm.nih.gov/pmc/blobs/14a0/7203287/5a997f864a83/41747_2020_154_Fig5_HTML.jpg
https://cdn.ncbi.nlm.nih.gov/pmc/blobs/14a0/7203287/0e599b7112c6/41747_2020_154_Fig6_HTML.jpg
https://cdn.ncbi.nlm.nih.gov/pmc/blobs/14a0/7203287/19107f9d0092/41747_2020_154_Fig7_HTML.jpg
https://cdn.ncbi.nlm.nih.gov/pmc/blobs/14a0/7203287/d78f1ea6c4c4/41747_2020_154_Fig8_HTML.jpg

相似文献

1
Inverse Laplace transform and multiexponential fitting analysis of T2 relaxometry data: a phantom study with aqueous and fat containing samples.逆拉普拉斯变换和 T2 弛豫测量数据的多指数拟合分析:含水溶液和脂肪样本的水模研究。
Eur Radiol Exp. 2020 May 7;4(1):28. doi: 10.1186/s41747-020-00154-5.
2
Multiexponential T2 relaxometry of benign and malignant adipocytic tumours.良性和恶性脂肪性肿瘤的多指数 T2 弛豫定量研究。
Eur Radiol Exp. 2020 Aug 3;4(1):45. doi: 10.1186/s41747-020-00175-0.
3
Multicomponent T2 relaxation studies of the avian egg.鸟类卵的多组分T2弛豫研究。
Magn Reson Med. 2016 May;75(5):2156-64. doi: 10.1002/mrm.25762. Epub 2015 Jun 2.
4
Bi-exponential T2 decay in dairy cream phantoms.乳脂模型中的双指数T2衰减
Magn Reson Imaging. 1998;16(1):83-5. doi: 10.1016/s0730-725x(97)00250-6.
5
Multiexponential Analysis of the Water T2-Relaxation in the Skeletal Muscle Provides Distinct Markers of Disease Activity Between Inflammatory and Dystrophic Myopathies.多指数分析骨骼肌水 T2 弛豫可提供炎症性和营养不良性肌病之间疾病活动的独特标志物。
J Magn Reson Imaging. 2021 Jan;53(1):181-189. doi: 10.1002/jmri.27300. Epub 2020 Aug 5.
6
Multiexponential proton spin-spin relaxation in MR imaging of human brain tumors.人脑肿瘤磁共振成像中的多指数质子自旋-自旋弛豫
J Comput Assist Tomogr. 1989 Jul-Aug;13(4):577-87. doi: 10.1097/00004728-198907000-00005.
7
The impact of spin coupling signal loss on fat content characterization in multi-echo acquisitions with different echo spacing.自旋耦合信号损失对具有不同回波间隔的多回波采集中脂肪含量表征的影响。
Magn Reson Imaging. 2017 May;38:6-12. doi: 10.1016/j.mri.2016.12.011. Epub 2016 Dec 13.
8
Optimized clinical T2 relaxometry with a standard CPMG sequence.采用标准CPMG序列的优化临床T2弛豫测量法。
J Magn Reson Imaging. 2006 Feb;23(2):248-52. doi: 10.1002/jmri.20490.
9
Tissue-Specific T * Biomarkers in Patellar Tendinopathy by Subregional Quantification Using 3D Ultrashort Echo Time MRI.使用3D超短回波时间MRI进行分区定量分析髌腱病中的组织特异性T *生物标志物
J Magn Reson Imaging. 2020 Aug;52(2):420-430. doi: 10.1002/jmri.27108. Epub 2020 Feb 28.
10
Stabilization of the inverse Laplace transform of multiexponential decay through introduction of a second dimension.通过引入第二维来稳定多指数衰减的逆拉普拉斯变换。
J Magn Reson. 2013 Nov;236:134-9. doi: 10.1016/j.jmr.2013.07.008. Epub 2013 Jul 24.

引用本文的文献

1
MRI Methods to Visualize and Quantify Adipose Tissue in Health and Disease.用于可视化和量化健康与疾病状态下脂肪组织的MRI方法
Biomedicines. 2023 Nov 29;11(12):3179. doi: 10.3390/biomedicines11123179.
2
Full-Harmonics Phasor Analysis: Unravelling Multiexponential Trends in Magnetic Resonance Imaging Data.全谐波相量分析:揭示磁共振成像数据中的多指数趋势
J Phys Chem Lett. 2020 Nov 5;11(21):9152-9158. doi: 10.1021/acs.jpclett.0c02319. Epub 2020 Oct 14.
3
Multiexponential T2 relaxometry of benign and malignant adipocytic tumours.

本文引用的文献

1
Inferring brain tissue composition and microstructure via MR relaxometry.通过磁共振弛豫定量技术推断脑组织成分和微观结构。
Neuroimage. 2018 Nov 15;182:136-148. doi: 10.1016/j.neuroimage.2017.12.087. Epub 2018 Jan 2.
2
Mono-Exponential Fitting in T2-Relaxometry: Relevance of Offset and First Echo.T2 弛豫测量中的单指数拟合:偏移和首个回波的相关性
PLoS One. 2015 Dec 17;10(12):e0145255. doi: 10.1371/journal.pone.0145255. eCollection 2015.
3
Multicomponent T2 relaxation studies of the avian egg.鸟类卵的多组分T2弛豫研究。
良性和恶性脂肪性肿瘤的多指数 T2 弛豫定量研究。
Eur Radiol Exp. 2020 Aug 3;4(1):45. doi: 10.1186/s41747-020-00175-0.
Magn Reson Med. 2016 May;75(5):2156-64. doi: 10.1002/mrm.25762. Epub 2015 Jun 2.
4
Multi-compartment T2 relaxometry using a spatially constrained multi-Gaussian model.使用空间约束多高斯模型的多室T2弛豫测量法。
PLoS One. 2014 Jun 4;9(6):e98391. doi: 10.1371/journal.pone.0098391. eCollection 2014.
5
MRI-based myelin water imaging: A technical review.基于磁共振成像的髓磷脂水成像:技术综述。
Magn Reson Med. 2015 Jan;73(1):70-81. doi: 10.1002/mrm.25198. Epub 2014 Mar 6.
6
T2 relaxometry of the infrapatellar fat pad after arthroscopic surgery.髌下脂肪垫关节镜手术后的 T2 弛豫时间测定。
Skeletal Radiol. 2014 Mar;43(3):315-21. doi: 10.1007/s00256-013-1791-4. Epub 2013 Dec 17.
7
Laplace Inversion of Low-Resolution NMR Relaxometry Data Using Sparse Representation Methods.使用稀疏表示方法对低分辨率核磁共振弛豫测量数据进行拉普拉斯反演
Concepts Magn Reson Part A Bridg Educ Res. 2013 May;42(3):72-88. doi: 10.1002/cmr.a.21263. Epub 2013 May 29.
8
Practical medical applications of quantitative MR relaxometry.定量磁共振弛豫测量在医学中的实际应用。
J Magn Reson Imaging. 2012 Oct;36(4):805-24. doi: 10.1002/jmri.23718.
9
Multicomponent T2 relaxation analysis in cartilage.软骨中的多成分T2弛豫分析
Magn Reson Med. 2009 Apr;61(4):803-9. doi: 10.1002/mrm.21926.
10
Testing the three-pool white matter model adapted for use with T2 relaxometry.测试适用于T2弛豫测量法的三池白质模型。
Magn Reson Med. 2005 Aug;54(2):449-54. doi: 10.1002/mrm.20599.