DeGroote School of Business, McMaster University, 1280 Main St. West, Hamilton, Ontario, L8S 4M4, Canada.
Clinical Analytics, Seattle Children's Hospital, Seattle, WA, USA.
Int Orthop. 2020 Aug;44(8):1581-1589. doi: 10.1007/s00264-020-04653-3. Epub 2020 Jun 5.
Accurately forecasting the occurrence of future covid-19-related cases across relaxed (Sweden) and stringent (USA and Canada) policy contexts has a renewed sense of urgency. Moreover, there is a need for a multidimensional county-level approach to monitor the second wave of covid-19 in the USA.
We use an artificial intelligence framework based on timeline of policy interventions that triangulated results based on the three approaches-Bayesian susceptible-infected-recovered (SIR), Kalman filter, and machine learning.
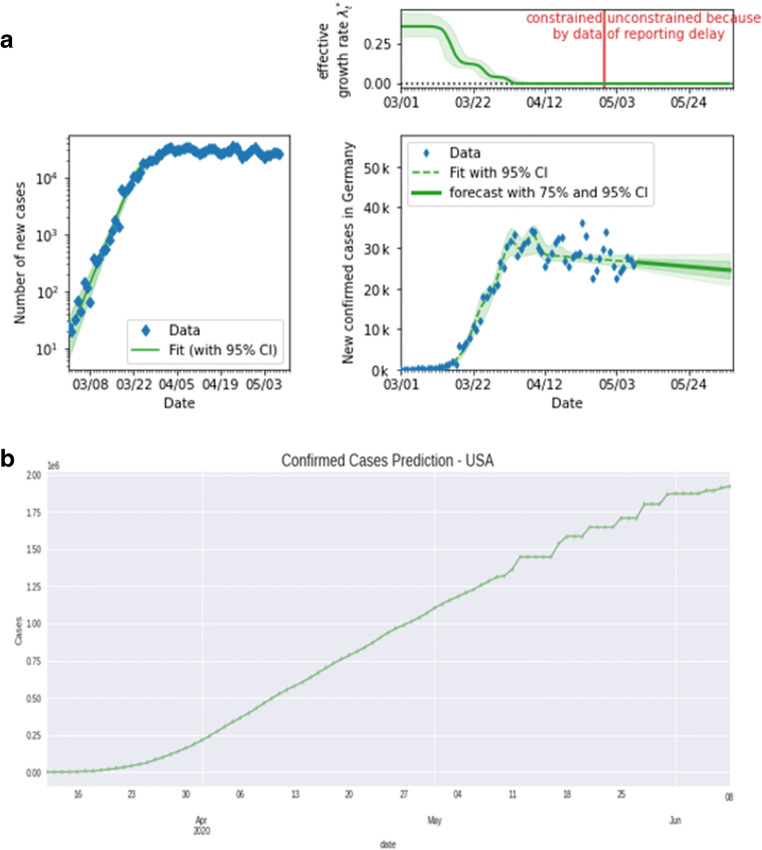
Our findings suggest three important insights. First, the effective growth rate of covid-19 infections dropped in response to the approximate dates of key policy interventions. We find that the change points for spreading rates approximately coincide with the timelines of policy interventions across respective countries. Second, forecasted trend until mid-June in the USA was downward trending, stable, and linear. Sweden is likely to be heading in the other direction. That is, Sweden's forecasted trend until mid-June appears to be non-linear and upward trending. Canada appears to fall somewhere in the middle-the trend for the same period is flat. Third, a Kalman filter based robustness check indicates that by mid-June the USA will likely have close to two million virus cases, while Sweden will likely have over 44,000 covid-19 cases.
We show that drop in effective growth rate of covid-19 infections was sharper in the case of stringent policies (USA and Canada) but was more gradual in the case of relaxed policy (Sweden). Our study exhorts policy makers to take these results into account as they consider the implications of relaxing lockdown measures.
准确预测放宽政策(瑞典)和严格政策(美国和加拿大)下未来与新冠病毒相关病例的发生情况具有新的紧迫性。此外,需要采用多维县级方法来监测美国第二波新冠病毒。
我们使用了一种基于政策干预时间线的人工智能框架,根据贝叶斯易感-感染-恢复(SIR)、卡尔曼滤波和机器学习三种方法的结果进行了三角测量。
我们的研究结果表明了三个重要的发现。首先,新冠病毒感染的有效增长率随着关键政策干预的近似日期而下降。我们发现,传播率的变化点与各自国家的政策干预时间线大致吻合。其次,截至 6 月中旬,美国的预测趋势呈下降、稳定和线性。瑞典可能朝着相反的方向发展。也就是说,瑞典截至 6 月中旬的预测趋势似乎是非线性和上升的。加拿大似乎处于中间位置——同一时期的趋势是平坦的。第三,基于卡尔曼滤波的稳健性检查表明,到 6 月中旬,美国可能将有近 200 万例病毒病例,而瑞典可能将有超过 44000 例新冠病毒病例。
我们表明,在严格政策(美国和加拿大)的情况下,新冠病毒感染有效增长率的下降更为明显,而在宽松政策(瑞典)的情况下,这一增长率的下降则更为缓慢。我们的研究告诫政策制定者在考虑放宽封锁措施的影响时,应考虑到这些结果。