School of Medicine, University of Wollongong, Wollongong 2522, Australia.
Illawarra Health and Medical Research Institute, Wollongong 2522, Australia.
Nutrients. 2020 Jul 8;12(7):2026. doi: 10.3390/nu12072026.
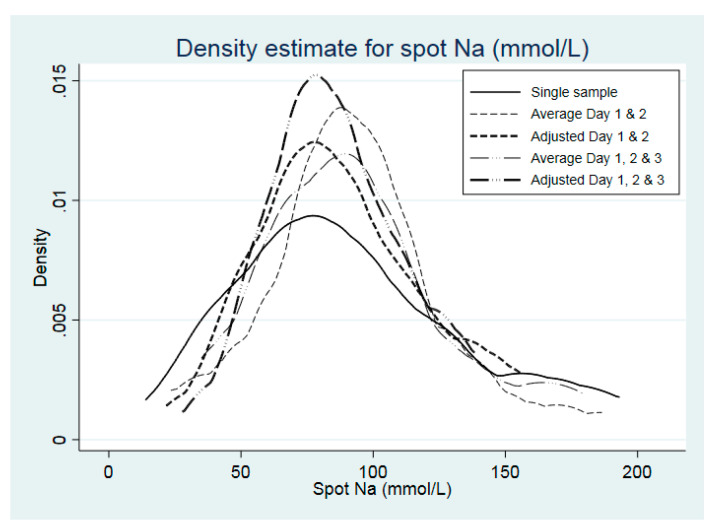
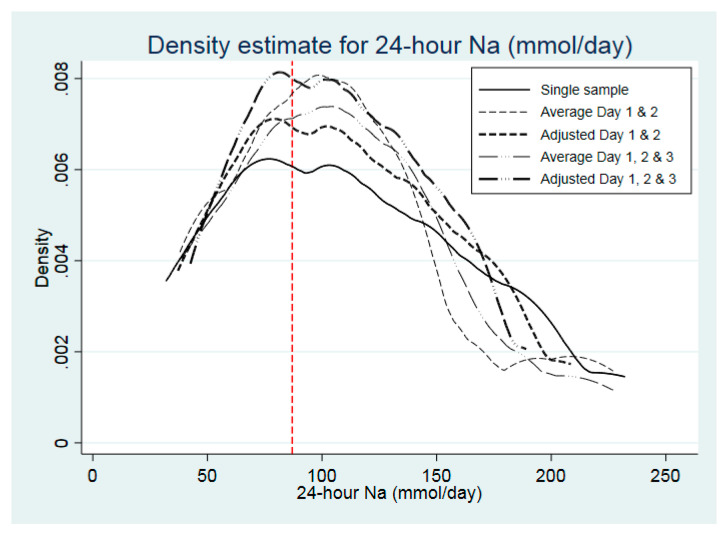
Given a global focus on salt reduction efforts to reduce cardiovascular risk, it is important to obtain accurate measures of salt intake on a population level. This study determined firstly whether adjustment for intra-individual variation in urinary sodium (Na) excretion using three repeated 24 h collections affects daily estimates and whether the use of repeated spot urine samples results in better prediction of 24 h Na compared to a single collection. Twenty three community-dwelling men and women from South Africa (mean age 59.7 years (SD = 15.6)) participating in the World Health Organization Study on global AGEing and adult health (WHO-SAGE) Wave 3 study collected 24 h and spot early morning urine samples over three consecutive days to assess urinary Na excretion. INTERSALT, Tanaka, and Kawasaki prediction equations, with either average or adjusted spot Na values, were used to estimate 24 h Na and compared these against measured 24 h urinary Na. Adjustment was performed by using the ratio of between-person (sb) and total (sobs) variability obtained from repeated measures analysis of variance. Sensitivity of the equations to predict daily urinary Na values below 5 g salt equivalent was calculated. The sb/sobs for urinary Na using three repeated samples for spot and 24 h samples were 0.706 and 0.798, respectively. Correction using analysis of variance for 3 × 24 h collections resulted in contraction of the upper end of the distribution curve (90th centile: 157 to 136 mmoL/day; 95th centile: 220 to 178 mmoL/day). All three prediction equations grossly over-estimated 24 h urinary Na excretion, regardless of whether a single spot urine or repeated collections corrected for intra-individual variation were used. Sensitivity of equations to detect salt intake equivalent values of ≤5 g/day was 13% for INTERSALT, while the other two equations had zero sensitivity. Correcting for intra-individual variability in Na excretion using three 24 h urine collections contracted the distribution curve for high intakes. Repeated collection of spot samples for urinary Na analysis does not improve the accuracy of predicting 24 h Na excretion. Spot urine samples are not appropriate to detect participants with salt intakes below the recommended 5 g/day.
鉴于全球都在努力减少盐的摄入量以降低心血管疾病风险,因此,获得人群中盐摄入量的准确数据非常重要。本研究首先确定了使用三次 24 小时尿液收集来调整个体内尿液钠(Na)排泄的个体内变异是否会影响每日估计值,以及使用重复的晨尿样本是否会比单次收集样本更好地预测 24 小时 Na。来自南非的 23 名社区居民(平均年龄 59.7 岁(SD=15.6))参加了世界卫生组织全球老龄化和成人健康研究(WHO-SAGE)第 3 波研究,连续三天收集 24 小时和晨尿样本,以评估尿钠排泄情况。使用 INTERSALT、Tanaka 和 Kawasaki 预测方程,结合平均或调整后的晨尿 Na 值,来估计 24 小时 Na 值,并将其与测量的 24 小时尿 Na 值进行比较。调整是通过重复测量方差分析获得的个体间(sb)和总体(sobs)变异比来进行的。还计算了方程预测每日尿 Na 值低于 5 克盐当量的灵敏度。使用三次重复样本的 sb/sobs 用于晨尿和 24 小时尿液样本分别为 0.706 和 0.798。使用 3×24 小时收集进行方差分析校正后,分布曲线的上限收缩(第 90 百分位数:157 至 136mmol/天;第 95 百分位数:220 至 178mmol/天)。所有三种预测方程都严重高估了 24 小时尿 Na 排泄,无论使用单次晨尿还是重复收集来校正个体内变异。INTERSALT 方程检测盐摄入量等于或小于 5 克/天的灵敏度为 13%,而其他两个方程的灵敏度为零。使用三次 24 小时尿液收集来校正 Na 排泄的个体内变异性会收缩高摄入量的分布曲线。重复收集晨尿样本进行尿 Na 分析并不能提高预测 24 小时 Na 排泄的准确性。晨尿样本不适用于检测盐摄入量低于推荐的 5 克/天的参与者。