Department of Ophthalmology, Shupyk National Medical Academy of Postgraduate Education; Kyiv City Clinical Ophthalmological Hospital "Eye Microsurgical Center", Kyiv, Ukraine.
NHS National Services Scotland, Edinburgh, United Kingdom.
Indian J Ophthalmol. 2021 May;69(5):1073-1079. doi: 10.4103/ijo.IJO_1168_20.
The aim of this study was to determine the effect of routine uncomplicated phacoemulsification on the orthogonal distribution of mass within the central optical zone of the cornea.
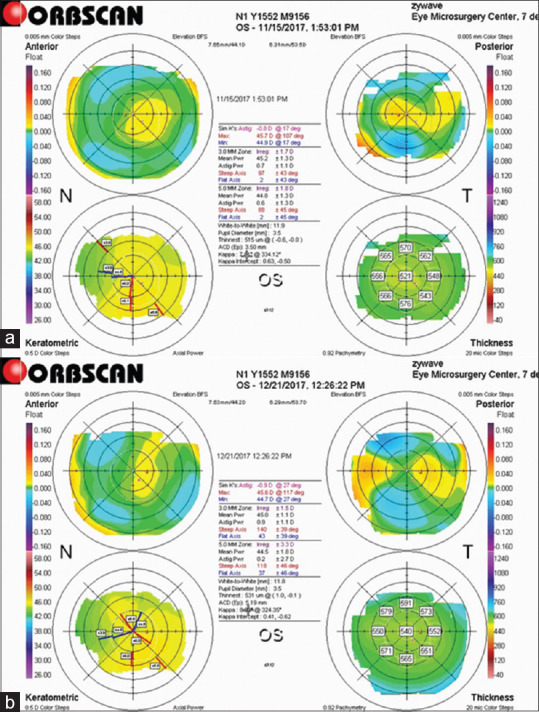
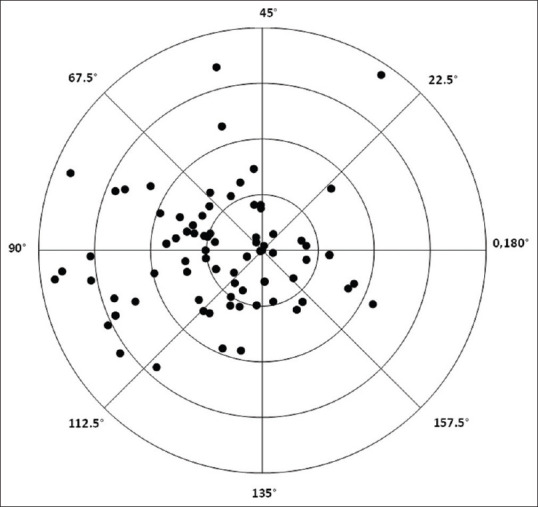
Astigmatism at both corneal surfaces was evaluated using Orbscan II (Bausch &and Lomb) before and up to 3 months after routine phacoemulsification (one eye/patient). The data were subjected to vector analysis to estimate the pre-and postoperative total astigmatism of the cornea (TCA).
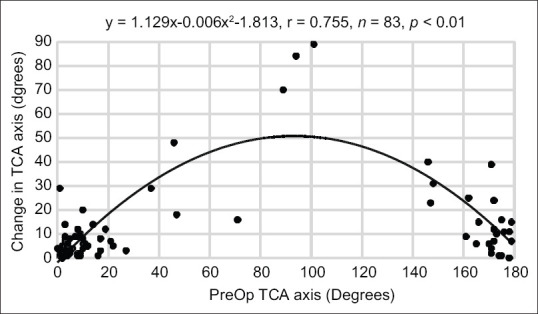
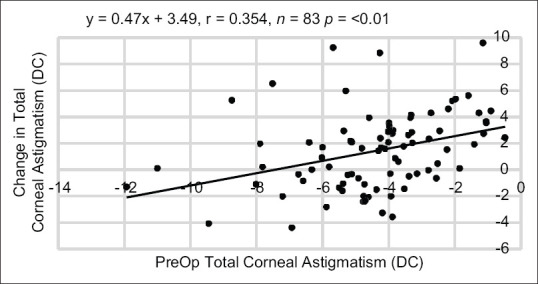
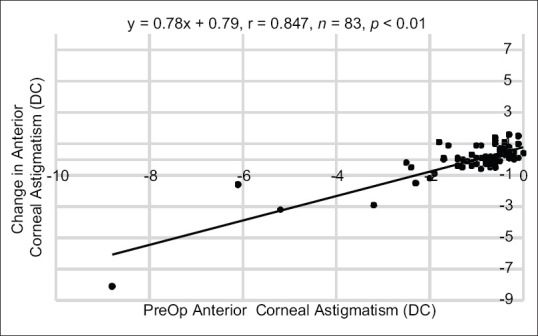
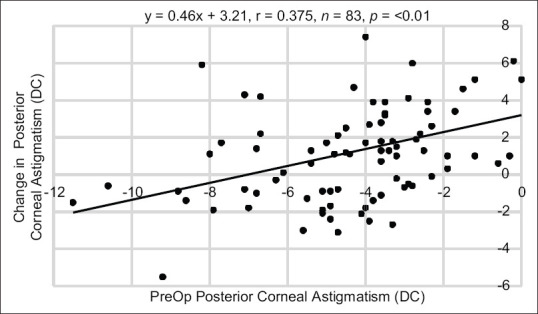
Reporting the chief findings in minus cylinder (diopters, DC) over the central 3 mm (A) and 5 mm (B) optical zones. Mean TCA powers (±sd) at pre- and 3-months postop were A) -4.45DC (±2.00) and -5.69DC (±2.69), B) -2.91DC (±2.22) and -2.71DC (±1.60). Change in mean power was significant over 3 mm (P < 0.01, n = 49) but not over 5 mm. Inter-zonal differences were significant (P < 0.01). There was a significant linear relationship between the change in TCA power (y = preoperative-postoperative) and TCA at preoperative stage (x) where, A) y = 0.45x + 3.12 (r = 0.336, n = 49, P = 0.018), B) y = x + 2.65 (r = 0.753, n = 49, P = <0.01). Over the central 3 mm zone only, change (preoperative-postoperative) in axis (°) of TCA (y) was significantly associated with TCA axis at preoperative stage (x) where y = 1.391x-0.008x-0.701 (r = 0.635, n = 49, P < 0.01).
Changes in TCA power and axis at 3 months postop, determined using Orbscan II, are indicative of orthogonal alterations in the distribution of corneal tissue. Over the central 3 mm zone, the association between y and x shows that a change in TCA axis is more profound when preoperative axis is near 90° i.e., against-the-rule.
本研究旨在确定常规非复杂性超声乳化白内障吸除术对角膜中央光学区质量的正交分布的影响。
使用 Orbscan II(Bausch & Lomb)在常规超声乳化白内障吸除术前和术后 3 个月评估角膜表面的散光(每只眼/患者)。将数据进行向量分析以估计角膜的术前和术后总散光(TCA)。
报告中央 3 毫米(A)和 5 毫米(B)光学区的负圆柱镜(屈光度,DC)的主要发现。术前和术后 3 个月的平均 TCA 功率(±标准差)为 A)-4.45DC(±2.00)和-5.69DC(±2.69),B)-2.91DC(±2.22)和-2.71DC(±1.60)。3 毫米处的平均功率变化有统计学意义(P < 0.01,n = 49),但 5 毫米处无统计学意义。区域间差异有统计学意义(P < 0.01)。TCA 功率变化(y = 术前-术后)与术前阶段 TCA(x)之间存在显著的线性关系,其中 A)y = 0.45x + 3.12(r = 0.336,n = 49,P = 0.018),B)y = x + 2.65(r = 0.753,n = 49,P < 0.01)。仅在中央 3 毫米区域,TCA(y)的轴(°)的变化(术前-术后)与术前阶段 TCA 轴(x)显著相关,其中 y = 1.391x-0.008x-0.701(r = 0.635,n = 49,P < 0.01)。
使用 Orbscan II 确定的术后 3 个月 TCA 功率和轴的变化表明角膜组织分布的正交改变。在中央 3 毫米区域,y 和 x 之间的关系表明,当术前轴接近 90°(即逆规性)时,TCA 轴的变化更为明显。