• 文献检索
  • 文档翻译
  • 深度研究
  • 学术资讯
  • Suppr Zotero 插件Zotero 插件
  • 邀请有礼
  • 套餐&价格
  • 历史记录
应用&插件
Suppr Zotero 插件Zotero 插件浏览器插件Mac 客户端Windows 客户端微信小程序
定价
高级版会员购买积分包购买API积分包
服务
文献检索文档翻译深度研究API 文档MCP 服务
关于我们
关于 Suppr公司介绍联系我们用户协议隐私条款
关注我们

Suppr 超能文献

核心技术专利:CN118964589B侵权必究
粤ICP备2023148730 号-1Suppr @ 2026

文献检索

告别复杂PubMed语法,用中文像聊天一样搜索,搜遍4000万医学文献。AI智能推荐,让科研检索更轻松。

立即免费搜索

文件翻译

保留排版,准确专业,支持PDF/Word/PPT等文件格式,支持 12+语言互译。

免费翻译文档

深度研究

AI帮你快速写综述,25分钟生成高质量综述,智能提取关键信息,辅助科研写作。

立即免费体验

地理风险因素在新冠疫情流行病学中的作用:纵向地理空间分析

Role of Geographic Risk Factors in COVID-19 Epidemiology: Longitudinal Geospatial Analysis.

作者信息

Juhn Young J, Wheeler Philip, Wi Chung-Il, Bublitz Joshua, Ryu Euijung, Ristagno Elizabeth H, Patten Christi

机构信息

Department of Pediatric and Adolescent Medicine, Mayo Clinic, Rochester, MN.

Department of Health Sciences Research, Mayo Clinic, Rochester, MN.

出版信息

Mayo Clin Proc Innov Qual Outcomes. 2021 Oct;5(5):916-927. doi: 10.1016/j.mayocpiqo.2021.06.011. Epub 2021 Jul 12.

DOI:10.1016/j.mayocpiqo.2021.06.011
PMID:34308261
原文链接:https://pmc.ncbi.nlm.nih.gov/articles/PMC8272975/
Abstract

OBJECTIVE

To perform a geospatial and temporal trend analysis for coronavirus disease 2019 (COVID-19) in a Midwest community to identify and characterize hot spots for COVID-19.

PARTICIPANTS AND METHODS

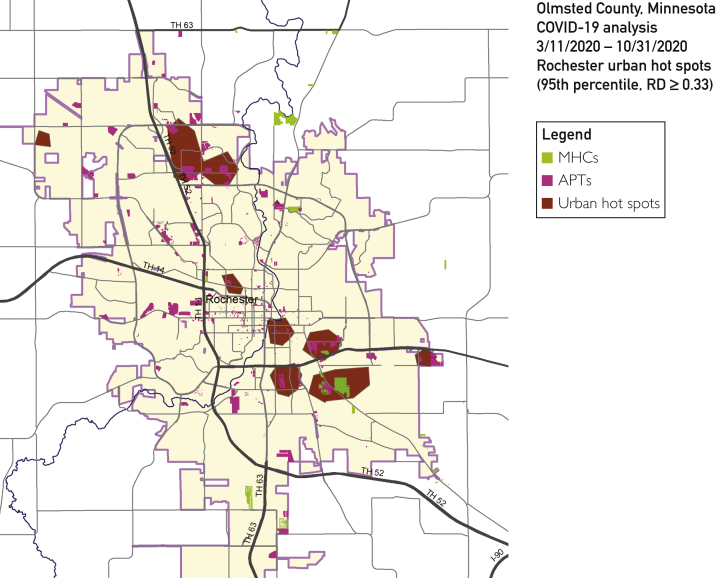
We conducted a population-based longitudinal surveillance assessing the semimonthly geospatial trends of the prevalence of test confirmed COVID-19 cases in Olmsted County, Minnesota, from March 11, 2020, through October 31, 2020. As urban areas accounted for 84% of the population and 86% of all COVID-19 cases in Olmsted County, MN, we determined hot spots for COVID-19 in urban areas (Rochester and other small cities) of Olmsted County, MN, during the study period by using kernel density analysis with a half-mile bandwidth.

RESULTS

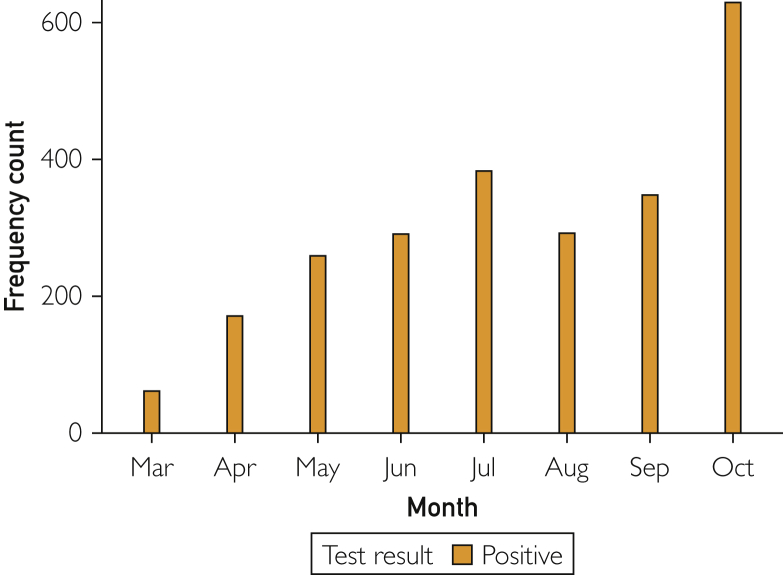
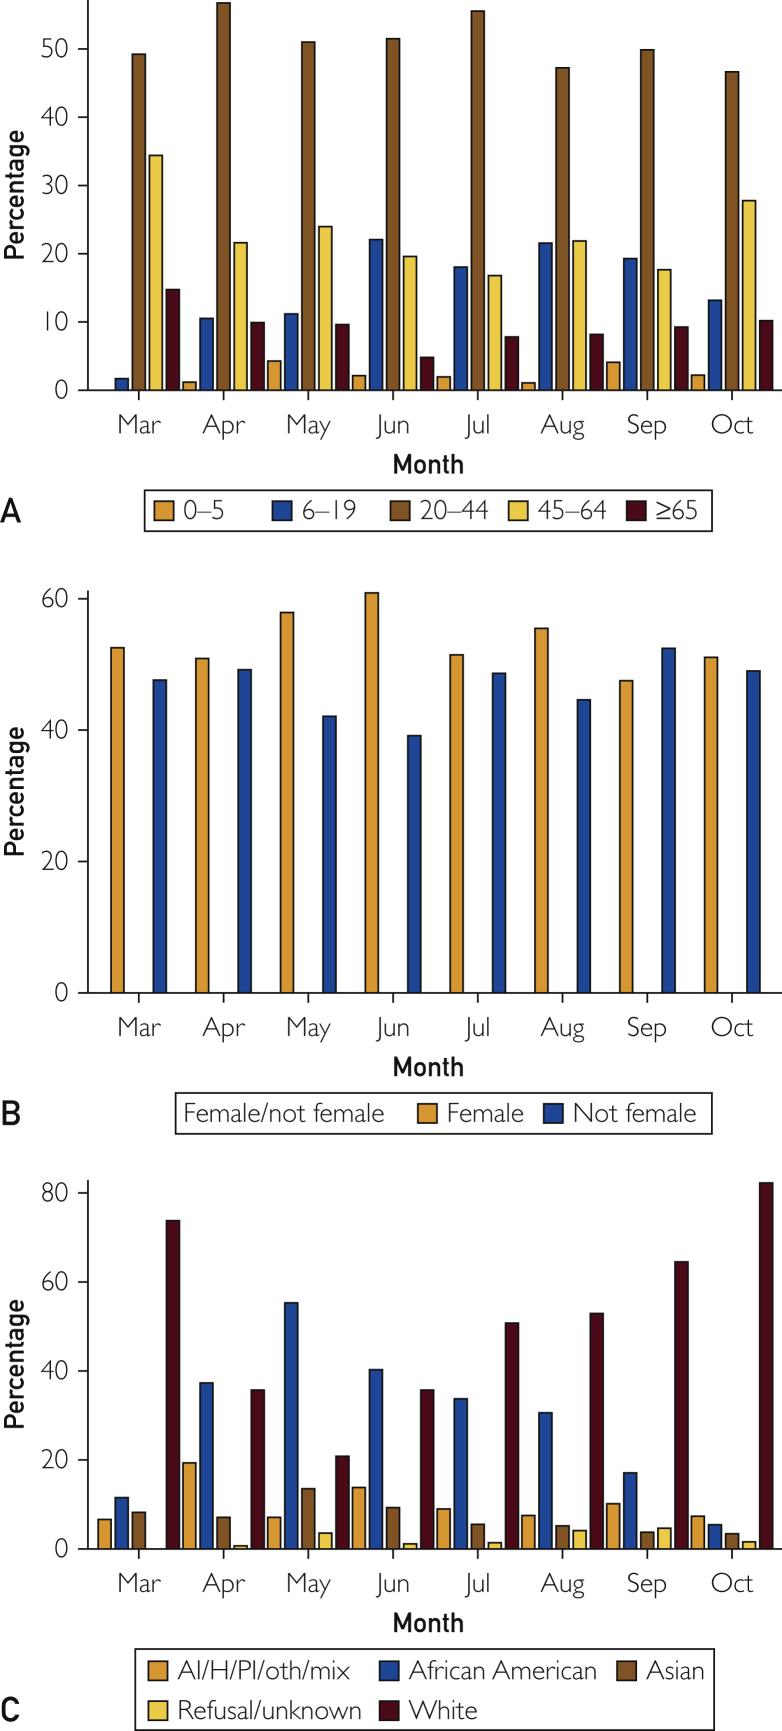
As of October 31, 2020, a total of 37,141 individuals (30%) were tested at least once, of whom 2433 (7%) tested positive. Testing rates among race groups were similar: 29% (black), 30% (Hispanic), 25% (Asian), and 31% (white). Ten urban hot spots accounted for 590 cases at 220 addresses (2.68 cases per address) as compared with 1843 cases at 1292 addresses in areas outside hot spots (1.43 cases per address). Overall, 12% of the population residing in hot spots accounted for 24% of all COVID-19 cases. Hot spots were concentrated in neighborhoods with low-income apartments and mobile home communities. People living in hot spots tended to be minorities and from a lower socioeconomic background.

CONCLUSION

Geographic and residential risk factors might considerably account for the overall burden of COVID-19 and its associated racial/ethnic and socioeconomic disparities. Results could geospatially guide community outreach efforts (eg, testing/tracing and vaccine rollout) for populations at risk for COVID-19.

摘要

目的

对中西部一个社区的2019冠状病毒病(COVID-19)进行地理空间和时间趋势分析,以识别和描述COVID-19的热点地区。

参与者与方法

我们开展了一项基于人群的纵向监测,评估了2020年3月11日至2020年10月31日期间明尼苏达州奥尔姆斯特德县经检测确诊的COVID-19病例患病率的半月度地理空间趋势。由于城市地区占明尼苏达州奥尔姆斯特德县人口的84%以及所有COVID-19病例的86%,我们在研究期间通过使用半英里带宽的核密度分析确定了明尼苏达州奥尔姆斯特德县城市地区(罗切斯特和其他小城市)的COVID-19热点地区。

结果

截至2020年10月31日,共有37141人(30%)至少接受了一次检测,其中2433人(7%)检测呈阳性。种族群体之间的检测率相似:黑人29%、西班牙裔30%、亚裔25%、白人31%。10个城市热点地区的220个地址出现了590例病例(每个地址2.68例),相比之下,热点地区以外的1292个地址出现了1843例病例(每个地址1.43例)。总体而言,居住在热点地区的人口中有12%占所有COVID-19病例的24%。热点地区集中在低收入公寓和移动房屋社区附近。居住在热点地区的人往往是少数族裔,且社会经济背景较低。

结论

地理和居住风险因素可能在很大程度上导致了COVID-19的总体负担及其相关的种族/族裔和社会经济差异。研究结果可为针对COVID-19高危人群的社区外展工作(如检测/追踪和疫苗推广)提供地理空间指导。

https://cdn.ncbi.nlm.nih.gov/pmc/blobs/3a0c/8455685/46c9ceba0eab/gr3.jpg
https://cdn.ncbi.nlm.nih.gov/pmc/blobs/3a0c/8455685/147cc2953a9a/gr1.jpg
https://cdn.ncbi.nlm.nih.gov/pmc/blobs/3a0c/8455685/67a89c5186e8/gr2ac.jpg
https://cdn.ncbi.nlm.nih.gov/pmc/blobs/3a0c/8455685/46c9ceba0eab/gr3.jpg
https://cdn.ncbi.nlm.nih.gov/pmc/blobs/3a0c/8455685/147cc2953a9a/gr1.jpg
https://cdn.ncbi.nlm.nih.gov/pmc/blobs/3a0c/8455685/67a89c5186e8/gr2ac.jpg
https://cdn.ncbi.nlm.nih.gov/pmc/blobs/3a0c/8455685/46c9ceba0eab/gr3.jpg

相似文献

1
Role of Geographic Risk Factors in COVID-19 Epidemiology: Longitudinal Geospatial Analysis.地理风险因素在新冠疫情流行病学中的作用:纵向地理空间分析
Mayo Clin Proc Innov Qual Outcomes. 2021 Oct;5(5):916-927. doi: 10.1016/j.mayocpiqo.2021.06.011. Epub 2021 Jul 12.
2
Role of geographic risk factors and social determinants of health in COVID-19 epidemiology: Longitudinal geospatial analysis in a midwest rural region.地理风险因素和健康的社会决定因素在新冠疫情流行病学中的作用:美国中西部农村地区的纵向地理空间分析
J Clin Transl Sci. 2021 Dec 27;6(1):e51. doi: 10.1017/cts.2021.885. eCollection 2022.
3
Assessment of Structural Barriers and Racial Group Disparities of COVID-19 Mortality With Spatial Analysis.利用空间分析评估 COVID-19 死亡率的结构性障碍和种族群体差异。
JAMA Netw Open. 2022 Mar 1;5(3):e220984. doi: 10.1001/jamanetworkopen.2022.0984.
4
Mobile home residence as a risk factor for adverse events among children in a mixed rural-urban community: A case for geospatial analysis.城乡结合部社区儿童不良事件风险因素之移动房屋居住情况:地理空间分析实例
J Clin Transl Sci. 2020 Apr 6;4(5):443-450. doi: 10.1017/cts.2020.34.
5
Identifying Neighborhoods with Cervical Cancer Disparities for Targeted Community Outreach and Engagement by an NCI-Designated Cancer Center: A Geospatial Approach.通过美国国立癌症研究所指定的癌症中心确定存在宫颈癌差异的社区以进行有针对性的社区宣传和参与:一种地理空间方法。
Cancer Epidemiol Biomarkers Prev. 2023 Oct 2;32(10):1275-1283. doi: 10.1158/1055-9965.EPI-23-0132.
6
Socioeconomic disparities in subway use and COVID-19 outcomes in New York City.纽约市地铁使用情况与新冠疫情结果中的社会经济差异。
medRxiv. 2020 May 30:2020.05.28.20115949. doi: 10.1101/2020.05.28.20115949.
7
Mapping the ChristianaCare response to COVID-19:: Clinical insights from the Value Institute's Geospatial Analytics Core.绘制克里斯蒂安娜医疗中心对新冠疫情的应对情况:来自价值研究所地理空间分析核心的临床见解
Dela J Public Health. 2020 Jul 1;6(2):66-70. doi: 10.32481/djph.2020.07.018. eCollection 2020 Jul.
8
Race/Ethnicity and Geographic Access to Urban Trauma Care.种族/民族和地理上获得城市创伤护理。
JAMA Netw Open. 2019 Mar 1;2(3):e190138. doi: 10.1001/jamanetworkopen.2019.0138.
9
Rates of Asymptomatic COVID-19 Infection and Associated Factors in Olmsted County, Minnesota, in the Prevaccination Era.明尼苏达州奥尔姆斯特德县疫苗接种前时代无症状新冠病毒感染率及相关因素
Mayo Clin Proc Innov Qual Outcomes. 2022 Dec;6(6):605-617. doi: 10.1016/j.mayocpiqo.2022.10.001. Epub 2022 Oct 18.
10
Asthma Surveillance - United States, 2006-2018.哮喘监测 - 美国,2006-2018 年。
MMWR Surveill Summ. 2021 Sep 17;70(5):1-32. doi: 10.15585/mmwr.ss7005a1.

引用本文的文献

1
Housing Characteristics of Areas With More Falls by Older Adults Living in Single-Family Detached Dwellings: A Cohort Study Using Geospatial Analysis.居住在独栋住宅中的老年人跌倒较多地区的住房特征:一项使用地理空间分析的队列研究。
Mayo Clin Proc Digit Health. 2024 Apr 5;2(2):259-269. doi: 10.1016/j.mcpdig.2024.04.001. eCollection 2024 Jun.
2
The Geographical Conditioning of Regional Differentiation Characterising the COVID-19 Pandemic in European Countries.欧洲国家 COVID-19 大流行区域分化特征的地理条件制约。
Int J Environ Res Public Health. 2024 Oct 10;21(10):1342. doi: 10.3390/ijerph21101342.
3
An assessment of excess mortality during the COVID-19 pandemic, a retrospective post-mortem surveillance in 12 districts - Zambia, 2020-2022.
评估 COVID-19 大流行期间的超额死亡率,2020-2022 年在赞比亚 12 个地区进行的回顾性死后监测。
BMC Public Health. 2024 Sep 27;24(1):2625. doi: 10.1186/s12889-024-20045-3.
4
A Study Examining the Impact of County-Level Demographic, Socioeconomic, and Political Affiliation Characteristics on COVID-19 Vaccination Patterns in Indiana.一项研究考察了印第安纳州县级人口、社会经济和政治党派特征对 COVID-19 疫苗接种模式的影响。
Int J Environ Res Public Health. 2024 Jul 9;21(7):892. doi: 10.3390/ijerph21070892.
5
Disparities in Influenza, Pneumococcal, COVID-19 Vaccine Coverage in High-Risk Adults Aged 19 to 64 Years in Southeastern Minnesota, 2010-2021.明尼苏达州东南部 19 至 64 岁高危成年人中流感、肺炎球菌和 COVID-19 疫苗接种率的差异,2010-2021 年。
Chest. 2024 Jul;166(1):49-60. doi: 10.1016/j.chest.2024.01.049. Epub 2024 Feb 9.
6
Rural Health Disparities in Allergy, Asthma, and Immunologic Diseases: The Current State and Future Direction for Clinical Care and Research.农村地区过敏、哮喘和免疫性疾病的健康差异:临床护理与研究的现状及未来方向
J Allergy Clin Immunol Pract. 2024 Feb;12(2):334-344. doi: 10.1016/j.jaip.2023.11.030. Epub 2023 Nov 25.
7
Bridging geographical disparities across 368 townships with healthcare system and socioeconomic factors in Taiwan.弥合台湾 368 个乡镇间医疗体系与社会经济因素的地域差距。
Sci Rep. 2023 Sep 11;13(1):15007. doi: 10.1038/s41598-023-42124-y.
8
Has COVID-19 changed how people think about the drivers of health? If so, does it matter?新冠病毒是否改变了人们对健康驱动因素的看法?如果是,这重要吗?
Front Health Serv. 2022 Nov 23;2:987226. doi: 10.3389/frhs.2022.987226. eCollection 2022.
9
Rates of Asymptomatic COVID-19 Infection and Associated Factors in Olmsted County, Minnesota, in the Prevaccination Era.明尼苏达州奥尔姆斯特德县疫苗接种前时代无症状新冠病毒感染率及相关因素
Mayo Clin Proc Innov Qual Outcomes. 2022 Dec;6(6):605-617. doi: 10.1016/j.mayocpiqo.2022.10.001. Epub 2022 Oct 18.
10
Role of geographic risk factors and social determinants of health in COVID-19 epidemiology: Longitudinal geospatial analysis in a midwest rural region.地理风险因素和健康的社会决定因素在新冠疫情流行病学中的作用:美国中西部农村地区的纵向地理空间分析
J Clin Transl Sci. 2021 Dec 27;6(1):e51. doi: 10.1017/cts.2021.885. eCollection 2022.