Health Data Research-UK, Swansea University, Singleton Park, Swansea SA1 8PP, UK.
Health Data Research-UK, Swansea University, Singleton Park, Swansea SA1 8PP, UK.
J Biomed Inform. 2021 Oct;122:103916. doi: 10.1016/j.jbi.2021.103916. Epub 2021 Sep 15.
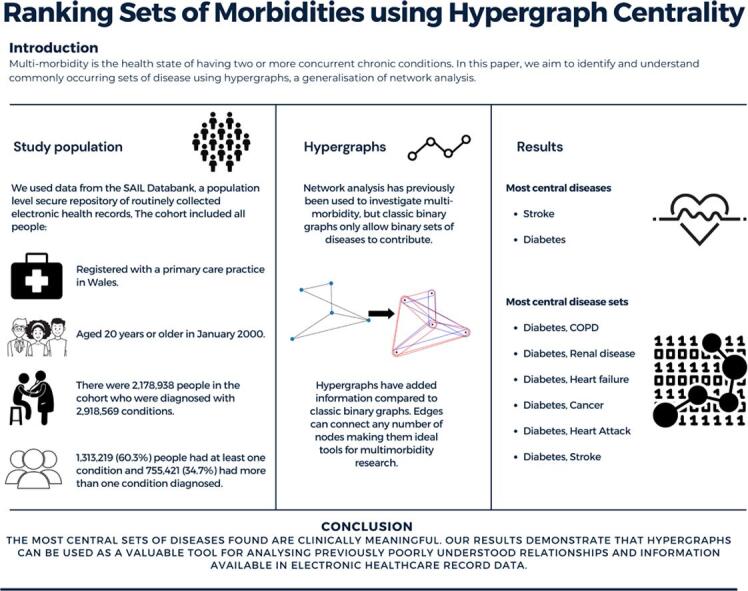
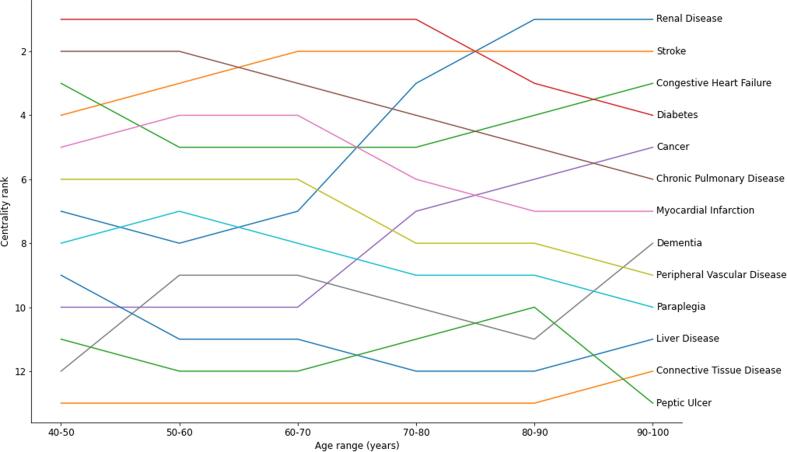
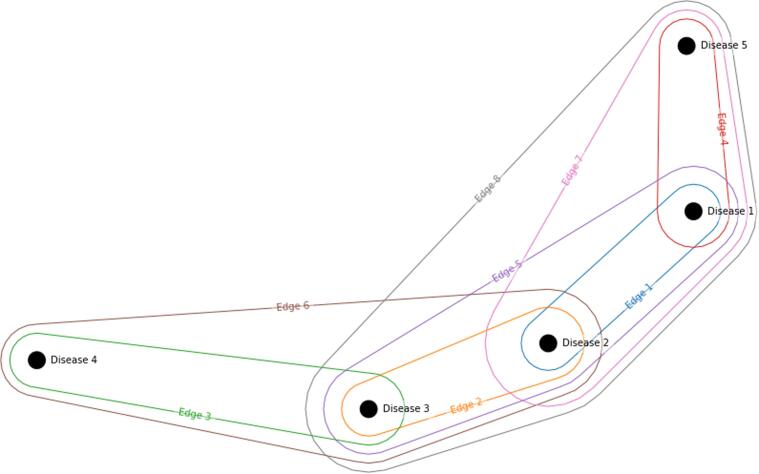
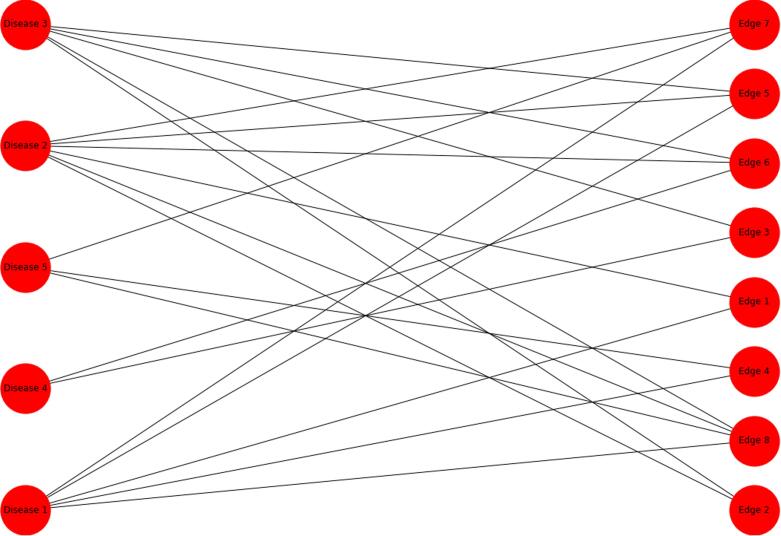
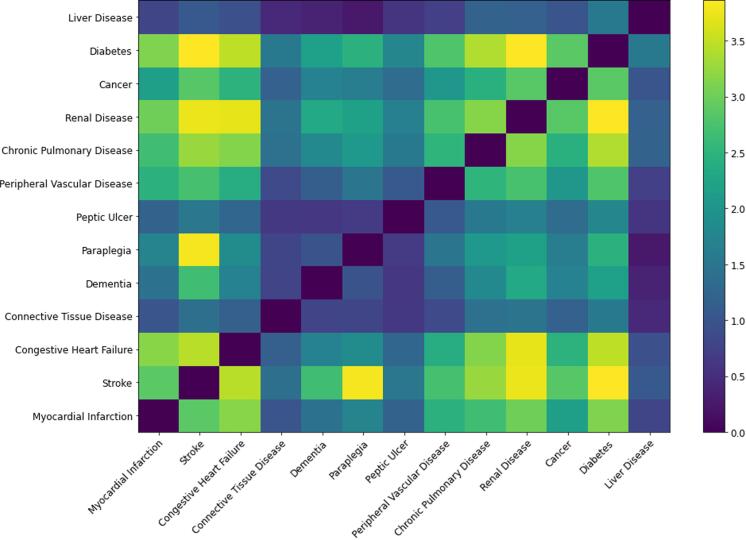
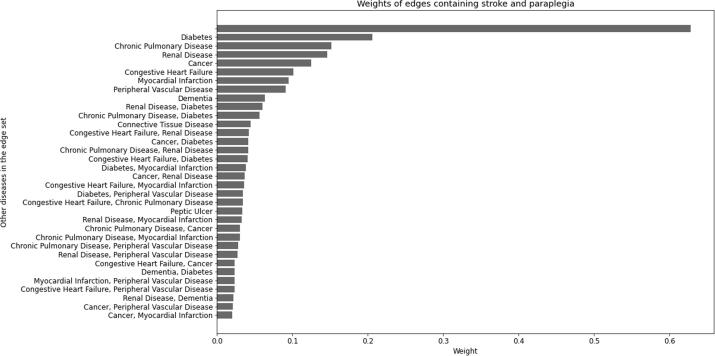
Multi-morbidity, the health state of having two or more concurrent chronic conditions, is becoming more common as populations age, but is poorly understood. Identifying and understanding commonly occurring sets of diseases is important to inform clinical decisions to improve patient services and outcomes. Network analysis has been previously used to investigate multi-morbidity, but a classic application only allows for information on binary sets of diseases to contribute to the graph. We propose the use of hypergraphs, which allows for the incorporation of data on people with any number of conditions, and also allows us to obtain a quantitative understanding of the centrality, a measure of how well connected items in the network are to each other, of both single diseases and sets of conditions. Using this framework we illustrate its application with the set of conditions described in the Charlson morbidity index using data extracted from routinely collected population-scale, patient level electronic health records (EHR) for a cohort of adults in Wales, UK. Stroke and diabetes were found to be the most central single conditions. Sets of diseases featuring diabetes; diabetes with Chronic Pulmonary Disease, Renal Disease, Congestive Heart Failure and Cancer were the most central pairs of diseases. We investigated the differences between results obtained from the hypergraph and a classic binary graph and found that the centrality of diseases such as paraplegia, which are connected strongly to a single other disease is exaggerated in binary graphs compared to hypergraphs. The measure of centrality is derived from the weighting metrics calculated for disease sets and further investigation is needed to better understand the effect of the metric used in identifying the clinical significance and ranked centrality of grouped diseases. These initial results indicate that hypergraphs can be used as a valuable tool for analysing previously poorly understood relationships and information available in EHR data.
多病共存,即同时患有两种或两种以上慢性疾病的健康状态,随着人口老龄化变得越来越普遍,但人们对此了解甚少。识别和理解常见的疾病组合对于为改善患者服务和结果提供临床决策信息非常重要。网络分析以前曾用于研究多病共存,但经典应用仅允许有关二进制疾病集的信息为图做出贡献。我们建议使用超图,它允许包含有关具有任意数量疾病的人群的数据,并且还使我们能够获得中心性的定量理解,中心性是网络中彼此之间连接良好的项的度量,这是网络中单个疾病和疾病集的度量。使用此框架,我们使用 Charlson 发病指数中描述的疾病集,使用从英国威尔士的成年人队列的常规收集的基于人群的患者水平电子健康记录(EHR)中提取的数据来说明其应用。中风和糖尿病被发现是最中心的单一疾病。以糖尿病为特征的疾病集;糖尿病与慢性肺部疾病,肾脏疾病,充血性心力衰竭和癌症是最中心的两对疾病。我们研究了从超图和经典二进制图获得的结果之间的差异,发现与二进制图相比,超图中截瘫等疾病的中心性与单个其他疾病的连接性更强,截瘫等疾病的中心性被夸大了。中心性是从为疾病集计算的加权指标中得出的,需要进一步研究以更好地了解用于识别分组疾病的临床意义和排名中心性的指标的影响。这些初步结果表明,超图可以用作分析以前了解甚少的关系和 EHR 数据中可用信息的有价值的工具。