• 文献检索
  • 文档翻译
  • 深度研究
  • 学术资讯
  • Suppr Zotero 插件Zotero 插件
  • 邀请有礼
  • 套餐&价格
  • 历史记录
应用&插件
Suppr Zotero 插件Zotero 插件浏览器插件Mac 客户端Windows 客户端微信小程序
定价
高级版会员购买积分包购买API积分包
服务
文献检索文档翻译深度研究API 文档MCP 服务
关于我们
关于 Suppr公司介绍联系我们用户协议隐私条款
关注我们

Suppr 超能文献

核心技术专利:CN118964589B侵权必究
粤ICP备2023148730 号-1Suppr @ 2026

文献检索

告别复杂PubMed语法,用中文像聊天一样搜索,搜遍4000万医学文献。AI智能推荐,让科研检索更轻松。

立即免费搜索

文件翻译

保留排版,准确专业,支持PDF/Word/PPT等文件格式,支持 12+语言互译。

免费翻译文档

深度研究

AI帮你快速写综述,25分钟生成高质量综述,智能提取关键信息,辅助科研写作。

立即免费体验

监测山区河流流域的景观格局和非点源污染特征。

Monitoring the Landscape Pattern and Characteristics of Non-Point Source Pollution in a Mountainous River Basin.

机构信息

College of Resources and Environment, Shandong Agricultural University, Tai'an 271018, China.

Natural Resources and Planning Bureau of Yixing County, Wuxi 214200, China.

出版信息

Int J Environ Res Public Health. 2021 Oct 20;18(21):11032. doi: 10.3390/ijerph182111032.

DOI:10.3390/ijerph182111032
PMID:34769560
原文链接:https://pmc.ncbi.nlm.nih.gov/articles/PMC8582686/
Abstract

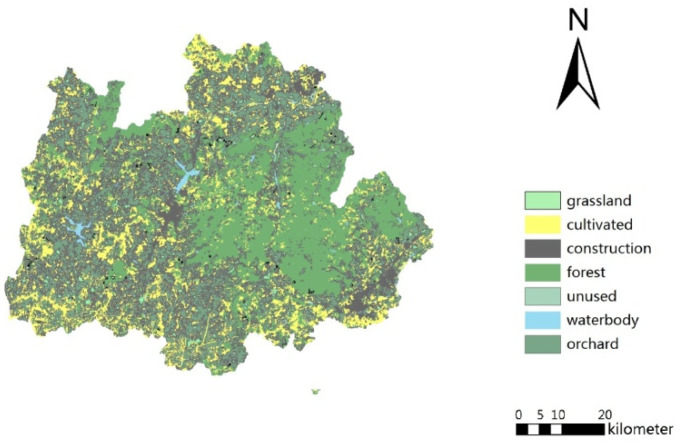
This study aimed to assess the relationship between the landscape patterns and non-point source (NPS) pollution distribution in Qixia County, China. The sub-basin classification was conducted based on a digital elevation model and Landsat8 satellite images. Water samples were collected from each sub-basin, andtheir water quality during the wet and dry seasons was estimated. The correlation between the landscape indices and water pollution indicators was determined by Pearson analysis. The location-weighted landscape contrast index () was calculated based on the "source-sink" theory. Qixia was further divided into five sections based on the score to illustrate the potential risk of NPS pollution. The results showed that the water quality in Qixia County was generally good. Cultivated land, orchards, construction areas, and unused land were positively correlated with the water pollution index and weredesignated as the "source" landscape categories, while forests, grasslands, and water bodies, which were negatively correlated with water pollution, were the "sink" landscapes; the was high in 36.94% of the study area. In these areas, measures such as increasing vegetation buffer zones are necessary to decrease the sediment and nutrient loads carried by precipitation.

摘要

本研究旨在评估中国栖霞县景观格局与非点源(NPS)污染分布之间的关系。根据数字高程模型和 Landsat8 卫星图像进行了子流域分类。从每个子流域采集水样,并在干湿季节估算其水质。通过 Pearson 分析确定景观指数与水污染指标之间的相关性。根据“源-汇”理论计算位置加权景观对比指数()。根据得分将栖霞进一步分为五个部分,以说明 NPS 污染的潜在风险。结果表明,栖霞县的水质总体良好。耕地、果园、建设用地和未利用地与水污染指数呈正相关,被指定为“源”景观类别,而与水污染呈负相关的森林、草地和水体则为“汇”景观;研究区 36.94%的地区的值较高。在这些地区,需要采取增加植被缓冲区等措施,以减少降水携带的泥沙和养分负荷。

https://cdn.ncbi.nlm.nih.gov/pmc/blobs/0acd/8582686/b6b5746b43b5/ijerph-18-11032-g007.jpg
https://cdn.ncbi.nlm.nih.gov/pmc/blobs/0acd/8582686/5f36b3923ee7/ijerph-18-11032-g001.jpg
https://cdn.ncbi.nlm.nih.gov/pmc/blobs/0acd/8582686/533485f36ace/ijerph-18-11032-g002.jpg
https://cdn.ncbi.nlm.nih.gov/pmc/blobs/0acd/8582686/192185905c38/ijerph-18-11032-g003.jpg
https://cdn.ncbi.nlm.nih.gov/pmc/blobs/0acd/8582686/fb19b9bc9fe7/ijerph-18-11032-g004.jpg
https://cdn.ncbi.nlm.nih.gov/pmc/blobs/0acd/8582686/02d67d75593b/ijerph-18-11032-g005.jpg
https://cdn.ncbi.nlm.nih.gov/pmc/blobs/0acd/8582686/567041f98f4e/ijerph-18-11032-g006.jpg
https://cdn.ncbi.nlm.nih.gov/pmc/blobs/0acd/8582686/b6b5746b43b5/ijerph-18-11032-g007.jpg

相似文献

1
Monitoring the Landscape Pattern and Characteristics of Non-Point Source Pollution in a Mountainous River Basin.监测山区河流流域的景观格局和非点源污染特征。
Int J Environ Res Public Health. 2021 Oct 20;18(21):11032. doi: 10.3390/ijerph182111032.
2
[Spatial scale effects of landscape patterns on non-point source pollution: A case study of Taizi River Basin in Northeast China].景观格局对非点源污染的空间尺度效应:以中国东北太子河流域为例
Ying Yong Sheng Tai Xue Bao. 2024 Apr 18;35(4):1112-1122. doi: 10.13287/j.1001-9332.202404.022.
3
Risk assessment of non-point source pollution based on landscape pattern in the Hanjiang River basin, China.基于景观格局的汉江流域非点源污染风险评估
Environ Sci Pollut Res Int. 2021 Dec;28(45):64322-64336. doi: 10.1007/s11356-021-15603-w. Epub 2021 Jul 24.
4
A source-sink landscape approach to mitigation of agricultural non-point source pollution: Validation and application.源汇景观方法在农业非点源污染缓解中的应用:验证与应用。
Environ Pollut. 2022 Dec 1;314:120287. doi: 10.1016/j.envpol.2022.120287. Epub 2022 Sep 27.
5
Nonpoint Pollution Source-Sink Landscape Pattern Change Analysis in a Coastal River Basin in Southeast China.中国东南部沿海流域非点源污染源-汇景观格局变化分析。
Int J Environ Res Public Health. 2018 Sep 26;15(10):2115. doi: 10.3390/ijerph15102115.
6
[Zonation on non-point source pollution risk in the lower reaches of Zijiang River based on the "source-sink" theory].基于“源-汇”理论的资江下游非点源污染风险分区
Ying Yong Sheng Tai Xue Bao. 2020 Oct;31(10):3518-3528. doi: 10.13287/j.1001-9332.202010.017.
7
[Correlating landscape pattern with total nitrogen concentration using a location-weighted sink-source landscape index in the Haihe River Basin, China].利用位置加权汇源景观指数关联中国海河流域景观格局与总氮浓度
Huan Jing Ke Xue. 2012 Jun;33(6):1784-8.
8
Spatial scale effects of integrated landscape indicators on river water quality in Chaohu Lake basin, China.中国巢湖流域综合景观指标对河流水质的空间尺度效应。
Environ Sci Pollut Res Int. 2023 Sep;30(45):100892-100906. doi: 10.1007/s11356-023-29482-w. Epub 2023 Aug 29.
9
Response of non-point source pollution to landscape pattern: case study in mountain-rural region, China.非点源污染对景观格局的响应:以中国山村地区为例。
Environ Sci Pollut Res Int. 2021 Apr;28(13):16602-16615. doi: 10.1007/s11356-020-12196-8. Epub 2021 Jan 3.
10
Modeling Land Use Changes and their Impacts on Non-Point Source Pollution in a Southeast China Coastal Watershed.建立模型研究中国东南沿海流域土地利用变化及其对非点源污染的影响。
Int J Environ Res Public Health. 2018 Jul 27;15(8):1593. doi: 10.3390/ijerph15081593.

引用本文的文献

1
Evolution characteristics and driving factors of potential non-point source pollution risks in a watershed affected by land use changes.土地利用变化影响下流域潜在面源污染风险的演变特征及驱动因素
Heliyon. 2024 Aug 30;10(17):e37247. doi: 10.1016/j.heliyon.2024.e37247. eCollection 2024 Sep 15.

本文引用的文献

1
Inhalation of ammonium sulfate and ammonium nitrate adversely affect sperm function.吸入硫酸铵和硝酸铵会对精子功能产生不良影响。
Reprod Toxicol. 2020 Sep;96:424-431. doi: 10.1016/j.reprotox.2020.08.009. Epub 2020 Aug 29.
2
Characterizing the heterogeneous correlations between the landscape patterns and seasonal variations of total nitrogen and total phosphorus in a peri-urban watershed.刻画城市周边流域中总氮和总磷的景观格局与季节变化之间的非均匀相关关系。
Environ Sci Pollut Res Int. 2020 Sep;27(27):34067-34077. doi: 10.1007/s11356-020-09441-5. Epub 2020 Jun 15.
3
Landscape patterns regulate non-point source nutrient pollution in an agricultural watershed.
景观格局调控农业流域非点源营养物污染。
Sci Total Environ. 2019 Jun 15;669:377-388. doi: 10.1016/j.scitotenv.2019.03.014. Epub 2019 Mar 2.
4
Modeling the non-point source pollution risks by combing pollutant sources, precipitation, and landscape structure.结合污染源、降水和景观结构对非点源污染风险进行建模。
Environ Sci Pollut Res Int. 2019 Apr;26(12):11856-11863. doi: 10.1007/s11356-019-04384-y. Epub 2019 Feb 28.
5
Water quality assessment in Qu River based on fuzzy water pollution index method.基于模糊水污染指数法的淠河流域水质评价
J Environ Sci (China). 2016 Dec;50:87-92. doi: 10.1016/j.jes.2016.03.030. Epub 2016 Jul 1.
6
Hydrological Impacts of Land Use Change and Climate Variability in the Headwater Region of the Heihe River Basin, Northwest China.中国西北黑河流域上游地区土地利用变化和气候变化的水文影响
PLoS One. 2016 Jun 27;11(6):e0158394. doi: 10.1371/journal.pone.0158394. eCollection 2016.
7
A method to analyze "source-sink" structure of non-point source pollution based on remote sensing technology.基于遥感技术的非点源污染“源-汇”结构分析方法。
Environ Pollut. 2013 Nov;182:135-40. doi: 10.1016/j.envpol.2013.07.006. Epub 2013 Jul 31.
8
Load estimation and source apportionment of nonpoint source nitrogen and phosphorus based on integrated application of SLURP model, ECM, and RUSLE: a case study in the Jinjiang River, China.基于 SLURP 模型、ECM 和 RUSLE 的综合应用的非点源氮磷负荷估算和来源解析:以中国晋江河流域为例。
Environ Monit Assess. 2013 Feb;185(2):2009-21. doi: 10.1007/s10661-012-2684-z. Epub 2012 May 29.
9
Agricultural non-point source pollution in China: causes and mitigation measures.中国农业面源污染:成因与缓解措施。
Ambio. 2012 Jun;41(4):370-9. doi: 10.1007/s13280-012-0249-6. Epub 2012 Feb 5.
10
Nonpoint source pollution responses simulation for conversion cropland to forest in mountains by SWAT in China.基于SWAT模型的中国山区退耕还林非点源污染响应模拟
Environ Manage. 2008 Jan;41(1):79-89. doi: 10.1007/s00267-007-9028-8.