Department of Oral and Maxillofacial Surgery, University Hospital of Aachen, Pauwelsstraße 30, 52074, Aachen, Germany.
Department of Orthodontics, University of Witten/Herdecke, Alfred-Herrhausen Str. 45, 58455, Witten, Germany.
Sci Rep. 2022 Mar 23;12(1):5013. doi: 10.1038/s41598-022-08991-7.
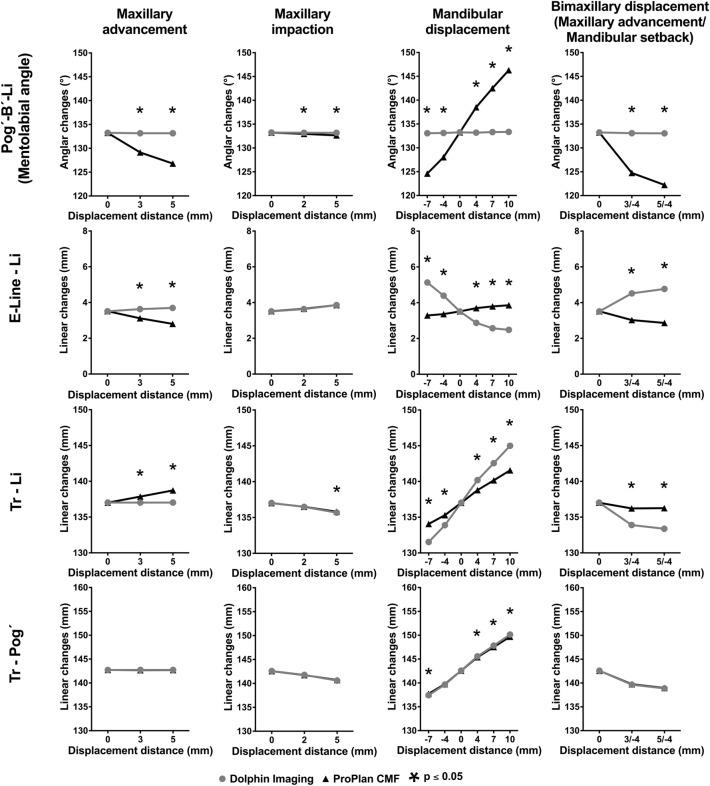
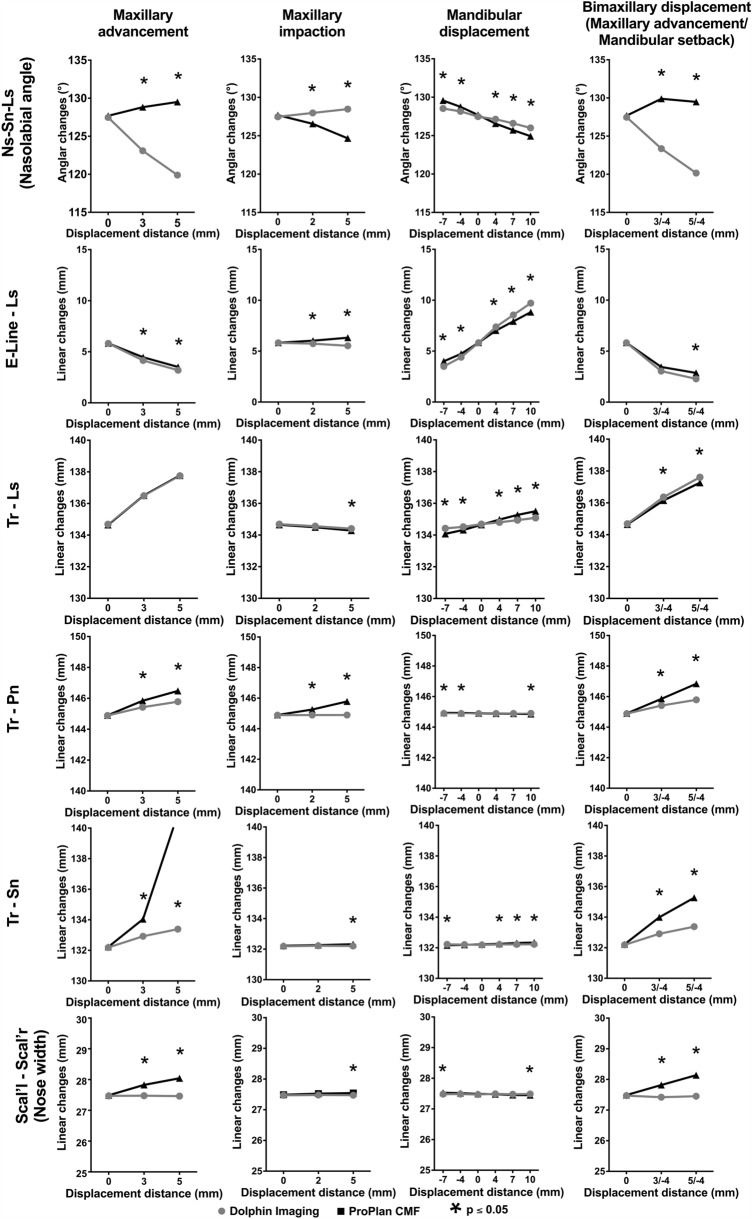
The aim of this study was to compare the soft tissue predicative abilities of two established programs depending on the surgical technique and amount of displacement. On the basis of 50 computed tomography images, 11 orthognathic operations with differences in displacement distances and technique (maxillary advancement, MxA; maxillary impaction, MxI; mandibular setback, MnS; mandibular advancement, MnA bimaxillary displacement, MxA/MnS) as well as corresponding soft tissue predictions were simulated using the programs Dolphin (D) and ProPlan (PP). For all the soft tissue predictions by the two programs, eight linear and two angular measurements were performed and compared. The simulation of maxillary impaction showed a similar soft tissue behaviour between the two programs. However, differences or divergent behaviours were observed for other procedures. In the middle third of the face these significant differences concerned in particular the nasolabial angle (Ns-Sn-Ls)(5 mm-MA, D: 119.9 ± 8.6° vs. PP: 129.5 ± 8.4°; 7 mm-MnS: D: 128.5 ± 8.2° vs. PP: 129.6 ± 8.1°; 10 mm-MnA D: 126.0 ± 8.0° vs. PP: 124.9 ± 8.4°; 5 mm-MxA/4 mm-MnS, D: 120.2 ± 8.7° vs. PP: 129.9 ± 8.3°; all p < 0.001) and in the lower third the mentolabial angle (Pog´-B´-Li) (5 mm-MA, D: 133.2 ± 11.4° vs. PP: 126.8 ± 11.6°; 7 mm-MnS: D: 133.1 ± 11.3° vs. PP: 124.6 ± 11.9°; 10 mm-MnA D: 133.3 ± 11.5° vs. PP: 146.3 ± 11.1°; bignathic 5 mm-MxA/4 mm-MnS, D: 133.1 ± 11.4° vs. PP: 122.7 ± 11.9°; all p < 0.001) and the distance of the inferior lip to the aesthetic Line (E-Line-Li) (5 mm-MA, D: 3.7 ± 2.3 mm vs. PP: 2.8 ± 2.5 mm; 7 mm-MnS: D: 5.1 ± 3.0 mm vs. PP: 3.3 ± 2.3 mm; 10 mm-MnA D: 2.5 ± 1.6 mm vs. PP: 3.9 ± 2.8 mm; bignathic 5 mm-MxA/4 mm-MnS, D: 4.8 ± 3.0 mm vs. PP: 2.9 ± 2.0 mm; all p < 0.001). The soft tissue predictions by the tested programs differed in simulation outcome, which led to the different, even divergent, results. However, the significant differences are often below a clinically relevant level. Consequently, soft tissue prediction must be viewed critically, and its actual benefit must be clarified.
本研究旨在比较两种既定程序在手术技术和位移量方面的软组织预测能力。基于 50 张计算机断层扫描图像,模拟了 11 例正畸手术,包括位移距离和技术的差异(上颌前突,MxA;上颌压入,MxI;下颌后退,MnS;下颌前突,MnA 双颌前突,MxA/MnS)以及相应的软组织预测。使用 Dolphin(D)和 ProPlan(PP)程序对所有软组织预测进行了 8 个线性和 2 个角度测量,并进行了比较。两种程序对上颌压入的软组织预测表现出相似的行为。然而,对于其他手术程序,观察到了差异或发散行为。在面部的中三分之一,这些显著差异特别涉及到鼻唇角(Ns-Sn-Ls)(5mm-MA,D:119.9±8.6° vs. PP:129.5±8.4°;7mm-MnS:D:128.5±8.2° vs. PP:129.6±8.1°;10mm-MnA,D:126.0±8.0° vs. PP:124.9±8.4°;5mm-MxA/4mm-MnS,D:120.2±8.7° vs. PP:129.9±8.3°;所有 p<0.001)和下三分之一的颏唇角(Pog´-B´-Li)(5mm-MA,D:133.2±11.4° vs. PP:126.8±11.6°;7mm-MnS:D:133.1±11.3° vs. PP:124.6±11.9°;10mm-MnA,D:133.3±11.5° vs. PP:146.3±11.1°;双颌前突 5mm-MxA/4mm-MnS,D:133.1±11.4° vs. PP:122.7±11.9°;所有 p<0.001)和下唇到美学线(E-Line-Li)的距离(5mm-MA,D:3.7±2.3mm vs. PP:2.8±2.5mm;7mm-MnS:D:5.1±3.0mm vs. PP:3.3±2.3mm;10mm-MnA,D:2.5±1.6mm vs. PP:3.9±2.8mm;双颌前突 5mm-MxA/4mm-MnS,D:4.8±3.0mm vs. PP:2.9±2.0mm;所有 p<0.001)。两种测试程序的软组织预测结果不同,导致了不同的甚至发散的结果。然而,显著差异往往低于临床相关水平。因此,必须对软组织预测进行批判性评估,并明确其实际效益。