Hammond Michael M, Zhang Yuankai, Pathiravasan Chathurangi H, Lin Honghuang, Sardana Mayank, Trinquart Ludovic, Benjamin Emelia J, Borrelli Belinda, Manders Emily S, Fusco Kelsey, Kornej Jelena, Spartano Nicole L, Kheterpal Vik, Nowak Christopher, McManus David D, Liu Chunyu, Murabito Joanne M
Boston University's and National Heart, Lung, and Blood Institute's Framingham Heart Study, Framingham, MA, United States.
Department of Biostatistics, Boston University School of Public Health, Boston, MA, United States.
JMIR Cardio. 2022 Apr 27;6(1):e32348. doi: 10.2196/32348.
The prevalence of obesity is rising. Most previous studies that examined the relations between BMI and physical activity (PA) measured BMI at a single timepoint. The association between BMI trajectories and habitual PA remains unclear.
This study assesses the relations between BMI trajectories and habitual step-based PA among participants enrolled in the electronic cohort of the Framingham Heart Study (eFHS).
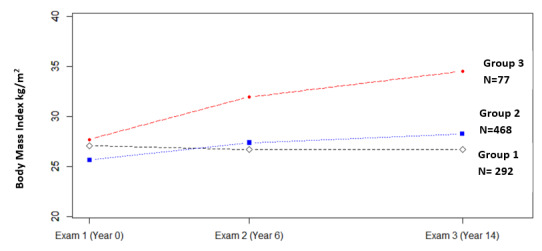
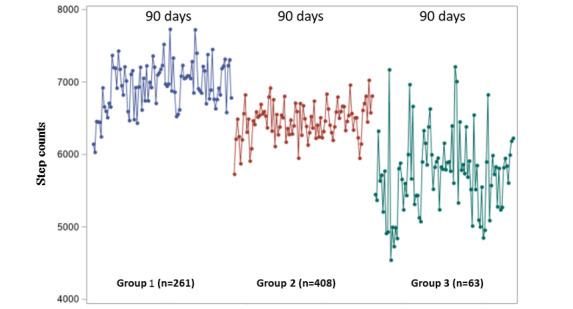
We used a semiparametric group-based modeling to identify BMI trajectories from eFHS participants who attended research examinations at the Framingham Research Center over 14 years. Daily steps were recorded from the smartwatch provided at examination 3. We excluded participants with <30 days or <5 hours of smartwatch wear data. We used generalized linear models to examine the association between BMI trajectories and daily step counts.
We identified 3 trajectory groups for the 837 eFHS participants (mean age 53 years; 57.8% [484/837] female). Group 1 included 292 participants whose BMI was stable (slope 0.005; P=.75), group 2 included 468 participants whose BMI increased slightly (slope 0.123; P<.001), and group 3 included 77 participants whose BMI increased greatly (slope 0.318; P<.001). The median follow-up period for step count was 516 days. Adjusting for age, sex, wear time, and cohort, participants in groups 2 and 3 took 422 (95% CI -823 to -21) and 1437 (95% CI -2084 to -790) fewer average daily steps, compared with participants in group 1. After adjusting for metabolic and social risk factors, group 2 took 382 (95% CI -773 to 10) and group 3 took 1120 (95% CI -1766 to -475) fewer steps, compared with group 1.
In this community-based eFHS, participants whose BMI trajectory increased greatly over time took significantly fewer steps, compared with participants with stable BMI trajectories. Our findings suggest that greater weight gain may correlate with lower levels of step-based physical activity.
肥胖的患病率正在上升。以前的大多数研究在单一时间点测量BMI来检验BMI与身体活动(PA)之间的关系。BMI轨迹与习惯性PA之间的关联仍不清楚。
本研究评估参加弗雷明汉心脏研究电子队列(eFHS)的参与者中BMI轨迹与基于步数的习惯性PA之间的关系。
我们使用基于半参数分组的模型,从在弗雷明汉研究中心参加了14年研究检查的eFHS参与者中识别BMI轨迹。在第三次检查时通过提供的智能手表记录每日步数。我们排除了智能手表佩戴数据少于30天或少于5小时的参与者。我们使用广义线性模型来检验BMI轨迹与每日步数之间的关联。
我们为837名eFHS参与者(平均年龄53岁;57.8%[484/837]为女性)确定了3个轨迹组。第1组包括292名BMI稳定的参与者(斜率0.005;P = 0.75),第2组包括468名BMI略有增加的参与者(斜率0.123;P < 0.001),第3组包括77名BMI大幅增加的参与者(斜率0.318;P < 0.001)。步数的中位随访期为516天。在调整年龄、性别、佩戴时间和队列后,与第1组参与者相比,第2组和第3组参与者平均每日步数分别少422步(95%CI -823至-21)和1437步(95%CI -2084至-790)。在调整代谢和社会风险因素后,与第1组相比,第2组少382步(95%CI -773至10),第3组少1120步(95%CI -1766至-475)。
在这个基于社区的eFHS中,与BMI轨迹稳定的参与者相比,BMI轨迹随时间大幅增加的参与者步数明显更少。我们的研究结果表明,体重增加更多可能与基于步数的身体活动水平较低相关。