• 文献检索
  • 文档翻译
  • 深度研究
  • 学术资讯
  • Suppr Zotero 插件Zotero 插件
  • 邀请有礼
  • 套餐&价格
  • 历史记录
应用&插件
Suppr Zotero 插件Zotero 插件浏览器插件Mac 客户端Windows 客户端微信小程序
定价
高级版会员购买积分包购买API积分包
服务
文献检索文档翻译深度研究API 文档MCP 服务
关于我们
关于 Suppr公司介绍联系我们用户协议隐私条款
关注我们

Suppr 超能文献

核心技术专利:CN118964589B侵权必究
粤ICP备2023148730 号-1Suppr @ 2026

文献检索

告别复杂PubMed语法,用中文像聊天一样搜索,搜遍4000万医学文献。AI智能推荐,让科研检索更轻松。

立即免费搜索

文件翻译

保留排版,准确专业,支持PDF/Word/PPT等文件格式,支持 12+语言互译。

免费翻译文档

深度研究

AI帮你快速写综述,25分钟生成高质量综述,智能提取关键信息,辅助科研写作。

立即免费体验

2020年3月至2022年2月新冠疫情期间美国各县的月度超额死亡率。

Monthly excess mortality across counties in the United States during the Covid-19 pandemic, March 2020 to February 2022.

作者信息

Paglino Eugenio, Lundberg Dielle J, Zhou Zhenwei, Wasserman Joe A, Raquib Rafeya, Luck Anneliese N, Hempstead Katherine, Bor Jacob, Preston Samuel H, Elo Irma T, Stokes Andrew C

机构信息

Department of Sociology and Population Studies Center, University of Pennsylvania, Philadelphia, PA.

Department of Global Health, Boston University School of Public Health, Boston, MA.

出版信息

medRxiv. 2022 Nov 21:2022.04.23.22274192. doi: 10.1101/2022.04.23.22274192.

DOI:10.1101/2022.04.23.22274192
PMID:35547848
原文链接:https://pmc.ncbi.nlm.nih.gov/articles/PMC9094106/
Abstract

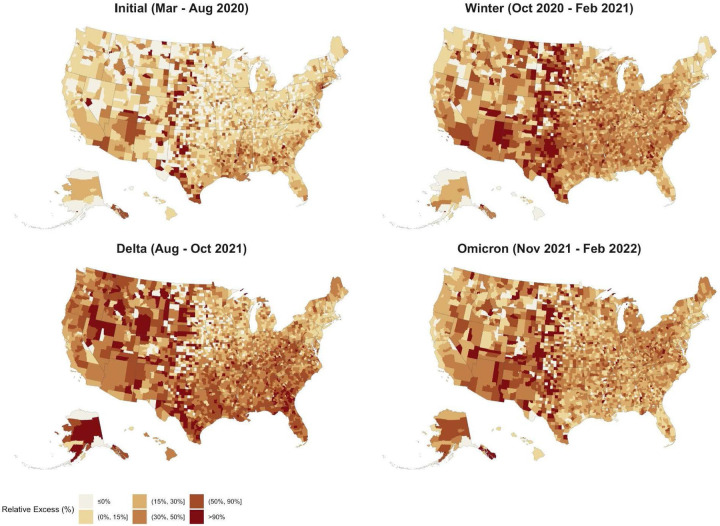
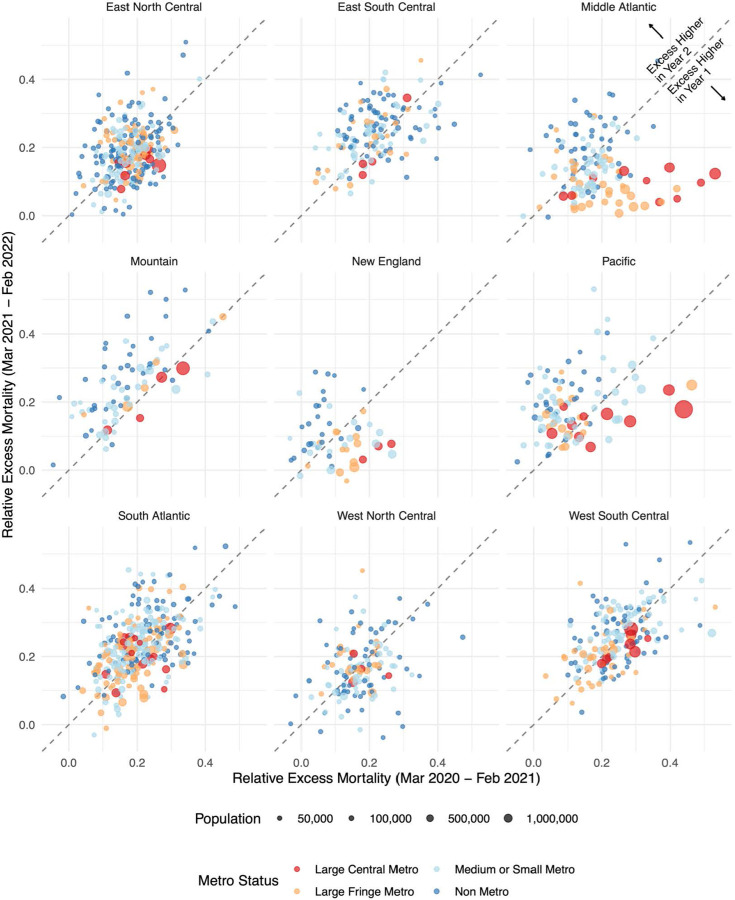
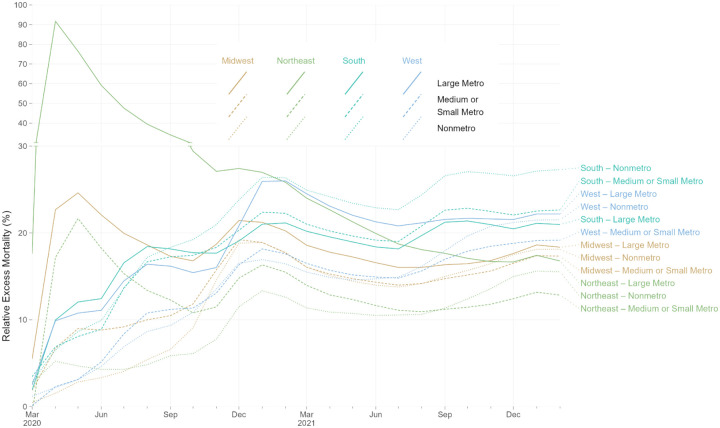
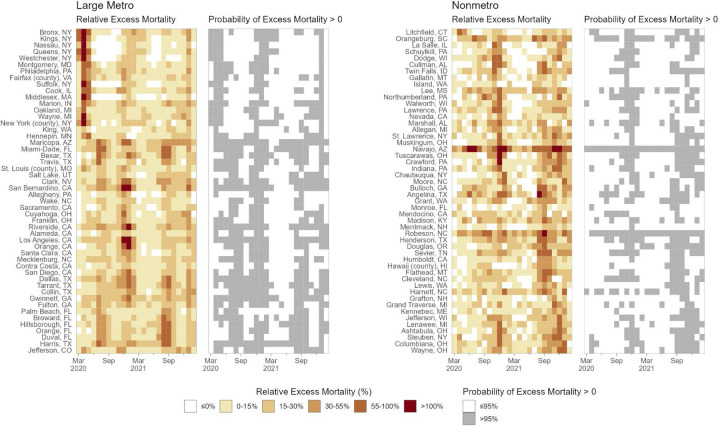
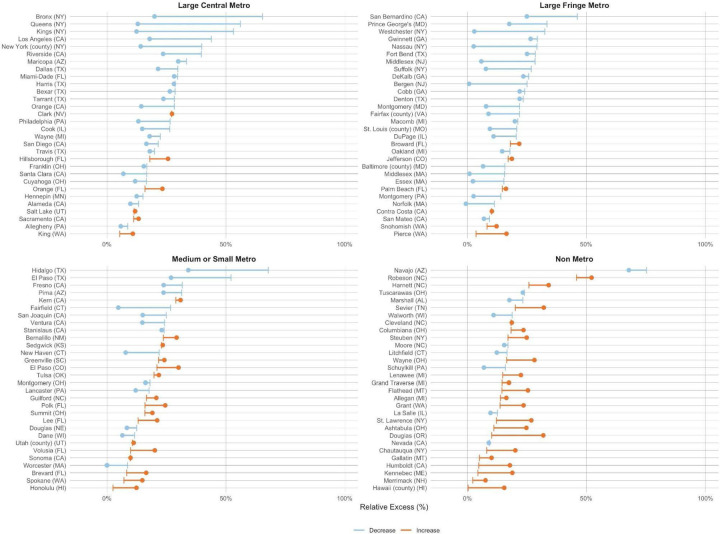
Excess mortality is the difference between expected and observed mortality in a given period and has emerged as a leading measure of the overall impact of the Covid-19 pandemic that is not biased by differences in testing or cause-of-death assignment. Spatially and temporally granular estimates of excess mortality are needed to understand which areas have been most impacted by the pandemic, evaluate exacerbating and mitigating factors, and inform response efforts, including allocating resources to affected communities. We estimated all-cause excess mortality for the United States from March 2020 through February 2022 by county and month using a Bayesian hierarchical model trained on data from 2015 to 2019. An estimated 1,159,580 excess deaths occurred during the first two years of the pandemic (first: 620,872; second: 538,708). Overall, excess mortality decreased in large metropolitan counties, but increased in nonmetro counties, between the first and second years of the pandemic. Despite the initial concentration of mortality in large metropolitan Northeast counties, beginning in February 2021, nonmetro South counties had the highest cumulative relative excess mortality. These results highlight the need for investments in rural health as the pandemic's disproportionate impact on rural areas continues to grow.

摘要

超额死亡率是指特定时期内预期死亡率与观察到的死亡率之间的差异,已成为衡量新冠疫情总体影响的主要指标,不受检测差异或死因判定差异的影响。需要对超额死亡率进行时空粒度估计,以了解哪些地区受疫情影响最大,评估加剧和缓解因素,并为应对措施提供信息,包括向受影响社区分配资源。我们使用基于2015年至2019年数据训练的贝叶斯分层模型,按县和月份估计了2020年3月至2022年2月美国的全因超额死亡率。在疫情的头两年估计发生了1159580例超额死亡(第一年:620872例;第二年:538708例)。总体而言,在疫情的第一年和第二年之间,大都市县的超额死亡率下降,但非大都市县的超额死亡率上升。尽管死亡率最初集中在东北部的大都市县,但从2021年2月开始,南部非大都市县的累计相对超额死亡率最高。这些结果凸显了投资农村卫生的必要性,因为疫情对农村地区的不成比例影响仍在不断扩大。

https://cdn.ncbi.nlm.nih.gov/pmc/blobs/87d3/9749539/ef0288d33540/nihpp-2022.04.23.22274192v4-f0008.jpg
https://cdn.ncbi.nlm.nih.gov/pmc/blobs/87d3/9749539/5ea93aba7508/nihpp-2022.04.23.22274192v4-f0001.jpg
https://cdn.ncbi.nlm.nih.gov/pmc/blobs/87d3/9749539/602ad6b7d27d/nihpp-2022.04.23.22274192v4-f0002.jpg
https://cdn.ncbi.nlm.nih.gov/pmc/blobs/87d3/9749539/1d1f0ea9ddf2/nihpp-2022.04.23.22274192v4-f0003.jpg
https://cdn.ncbi.nlm.nih.gov/pmc/blobs/87d3/9749539/8c6cf8bd6f7a/nihpp-2022.04.23.22274192v4-f0004.jpg
https://cdn.ncbi.nlm.nih.gov/pmc/blobs/87d3/9749539/95f7518f7f42/nihpp-2022.04.23.22274192v4-f0005.jpg
https://cdn.ncbi.nlm.nih.gov/pmc/blobs/87d3/9749539/c535a7cb27ee/nihpp-2022.04.23.22274192v4-f0006.jpg
https://cdn.ncbi.nlm.nih.gov/pmc/blobs/87d3/9749539/f03b2dd17c1d/nihpp-2022.04.23.22274192v4-f0007.jpg
https://cdn.ncbi.nlm.nih.gov/pmc/blobs/87d3/9749539/ef0288d33540/nihpp-2022.04.23.22274192v4-f0008.jpg

相似文献

1
Monthly excess mortality across counties in the United States during the Covid-19 pandemic, March 2020 to February 2022.2020年3月至2022年2月新冠疫情期间美国各县的月度超额死亡率。
medRxiv. 2022 Nov 21:2022.04.23.22274192. doi: 10.1101/2022.04.23.22274192.
2
Monthly excess mortality across counties in the United States during the COVID-19 pandemic, March 2020 to February 2022.美国 COVID-19 大流行期间各州县 2020 年 3 月至 2022 年 2 月的月度超额死亡率。
Sci Adv. 2023 Jun 23;9(25):eadf9742. doi: 10.1126/sciadv.adf9742.
3
Differences Between Reported COVID-19 Deaths and Estimated Excess Deaths in Counties Across the United States, March 2020 to February 2022.2020年3月至2022年2月美国各县报告的新冠病毒疾病(COVID-19)死亡人数与估计超额死亡人数的差异
medRxiv. 2023 Jan 18:2023.01.16.23284633. doi: 10.1101/2023.01.16.23284633.
4
Excess natural-cause mortality in US counties and its association with reported COVID-19 deaths.美国县的超额自然原因死亡率及其与报告的 COVID-19 死亡的关联。
Proc Natl Acad Sci U S A. 2024 Feb 6;121(6):e2313661121. doi: 10.1073/pnas.2313661121. Epub 2024 Feb 1.
5
Potentially Excess Deaths from the Five Leading Causes of Death in Metropolitan and Nonmetropolitan Counties - United States, 2010-2017.大都市和县和非大都市县五个主要死因的潜在超额死亡人数-美国,2010-2017 年。
MMWR Surveill Summ. 2019 Nov 8;68(10):1-11. doi: 10.15585/mmwr.ss6810a1.
6
County-level estimates of excess mortality associated with COVID-19 in the United States.美国县级与新冠病毒疾病相关的超额死亡率估计数。
SSM Popul Health. 2022 Mar;17:101021. doi: 10.1016/j.ssmph.2021.101021. Epub 2022 Jan 5.
7
Assessing the Impact of the Covid-19 Pandemic on US Mortality: A County-Level Analysis.评估新冠疫情对美国死亡率的影响:县级分析。
medRxiv. 2021 Mar 22:2020.08.31.20184036. doi: 10.1101/2020.08.31.20184036.
8
COVID-19 and excess mortality in the United States: A county-level analysis.新冠疫情与美国超额死亡:县级分析
PLoS Med. 2021 May 20;18(5):e1003571. doi: 10.1371/journal.pmed.1003571. eCollection 2021 May.
9
Disparities in COVID-19 Mortality Rates: Implications for Rural Health Policy and Preparedness.新冠死亡率的差异:对农村卫生政策和准备工作的影响。
J Public Health Manag Pract. 2022;28(5):478-485. doi: 10.1097/PHH.0000000000001507. Epub 2022 Apr 5.
10
Excess death among Latino people in California during the COVID-19 pandemic.新冠疫情期间加利福尼亚州拉丁裔人群的超额死亡情况。
medRxiv. 2021 Jan 25:2020.12.18.20248434. doi: 10.1101/2020.12.18.20248434.

本文引用的文献

1
Rural-urban outcome differences associated with COVID-19 hospitalizations in North Carolina.北卡罗来纳州 COVID-19 住院患者城乡结局差异。
PLoS One. 2022 Aug 17;17(8):e0271755. doi: 10.1371/journal.pone.0271755. eCollection 2022.
2
Excess deaths in the United States during the first year of COVID-19.美国在 COVID-19 大流行的第一年的超额死亡人数。
Prev Med. 2022 Sep;162:107174. doi: 10.1016/j.ypmed.2022.107174. Epub 2022 Jul 22.
3
Excess natural-cause deaths in California by cause and setting: March 2020 through February 2021.
2020年3月至2021年2月期间,加利福尼亚州因自然原因导致的超额死亡情况,按死因和环境分类
PNAS Nexus. 2022 Jun 8;1(3):pgac079. doi: 10.1093/pnasnexus/pgac079. eCollection 2022 Jul.
4
Estimating excess mortality due to the COVID-19 pandemic: a systematic analysis of COVID-19-related mortality, 2020-21.估算2019冠状病毒病大流行造成的超额死亡率:2020 - 2021年与2019冠状病毒病相关死亡率的系统分析
Lancet. 2022 Apr 16;399(10334):1513-1536. doi: 10.1016/S0140-6736(21)02796-3. Epub 2022 Mar 10.
5
Disparities in COVID-19 Vaccination Coverage Between Urban and Rural Counties - United States, December 14, 2020-January 31, 2022.城乡地区 COVID-19 疫苗接种率的差异-美国,2020 年 12 月 14 日-2022 年 1 月 31 日。
MMWR Morb Mortal Wkly Rep. 2022 Mar 4;71(9):335-340. doi: 10.15585/mmwr.mm7109a2.
6
Regional excess mortality during the 2020 COVID-19 pandemic in five European countries.2020 年 COVID-19 大流行期间五个欧洲国家的区域超额死亡率。
Nat Commun. 2022 Jan 25;13(1):482. doi: 10.1038/s41467-022-28157-3.
7
County-level estimates of excess mortality associated with COVID-19 in the United States.美国县级与新冠病毒疾病相关的超额死亡率估计数。
SSM Popul Health. 2022 Mar;17:101021. doi: 10.1016/j.ssmph.2021.101021. Epub 2022 Jan 5.
8
Application of Bayesian spatial-temporal models for estimating unrecognized COVID-19 deaths in the United States.贝叶斯时空模型在美国估计未被识别的新冠死亡病例中的应用
Spat Stat. 2022 Aug;50:100584. doi: 10.1016/j.spasta.2021.100584. Epub 2022 Jan 4.
9
Association of Health Care Factors With Excess Deaths Not Assigned to COVID-19 in the US.医疗保健因素与美国超额死亡人数(未归因于 COVID-19)的关联
JAMA Netw Open. 2021 Sep 1;4(9):e2125287. doi: 10.1001/jamanetworkopen.2021.25287.
10
Eviction Moratoria Expiration and COVID-19 Infection Risk Across Strata of Health and Socioeconomic Status in the United States.驱逐禁令终止与美国不同健康和社会经济地位阶层的 COVID-19 感染风险
JAMA Netw Open. 2021 Aug 2;4(8):e2129041. doi: 10.1001/jamanetworkopen.2021.29041.