• 文献检索
  • 文档翻译
  • 深度研究
  • 学术资讯
  • Suppr Zotero 插件Zotero 插件
  • 邀请有礼
  • 套餐&价格
  • 历史记录
应用&插件
Suppr Zotero 插件Zotero 插件浏览器插件Mac 客户端Windows 客户端微信小程序
定价
高级版会员购买积分包购买API积分包
服务
文献检索文档翻译深度研究API 文档MCP 服务
关于我们
关于 Suppr公司介绍联系我们用户协议隐私条款
关注我们

Suppr 超能文献

核心技术专利:CN118964589B侵权必究
粤ICP备2023148730 号-1Suppr @ 2026

文献检索

告别复杂PubMed语法,用中文像聊天一样搜索,搜遍4000万医学文献。AI智能推荐,让科研检索更轻松。

立即免费搜索

文件翻译

保留排版,准确专业,支持PDF/Word/PPT等文件格式,支持 12+语言互译。

免费翻译文档

深度研究

AI帮你快速写综述,25分钟生成高质量综述,智能提取关键信息,辅助科研写作。

立即免费体验

利用CrIS氮氧化物测量数据和GEOS-Chem伴随模式与双向和单向通量方案对欧洲氮氧化物排放进行4D-Var反演

4D-Var Inversion of European NH Emissions Using CrIS NH Measurements and GEOS-Chem Adjoint With Bi-Directional and Uni-Directional Flux Schemes.

作者信息

Cao Hansen, Henze Daven K, Zhu Liye, Shephard Mark W, Cady-Pereira Karen, Dammers Enrico, Sitwell Michael, Heath Nicholas, Lonsdale Chantelle, Bash Jesse O, Miyazaki Kazuyuki, Flechard Christophe, Fauvel Yannick, Kruit Roy Wichink, Feigenspan Stefan, Brümmer Christian, Schrader Frederik, Twigg Marsailidh M, Leeson Sarah, Tang Yuk S, Stephens Amy C M, Braban Christine, Vincent Keith, Meier Mario, Seitler Eva, Geels Camilla, Ellermann Thomas, Sanocka Agnieszka, Capps Shannon L

机构信息

University of Colorado Boulder CO USA.

Sun Yat-sen University Zhuhai China.

出版信息

J Geophys Res Atmos. 2022 May 16;127(9):e2021JD035687. doi: 10.1029/2021JD035687. Epub 2022 May 6.

DOI:10.1029/2021JD035687
PMID:35865809
原文链接:
https://pmc.ncbi.nlm.nih.gov/articles/PMC9286853/
Abstract

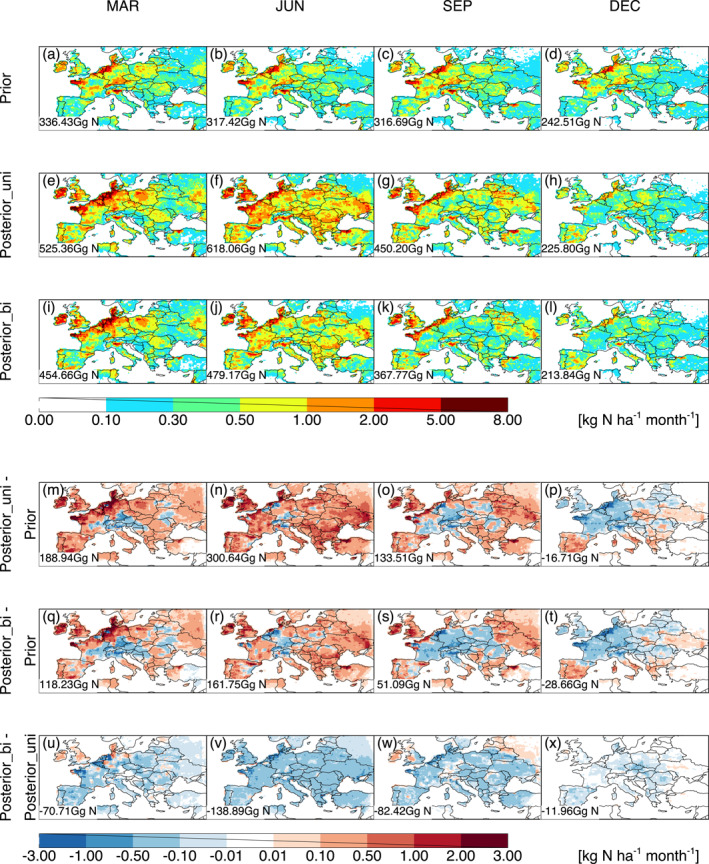
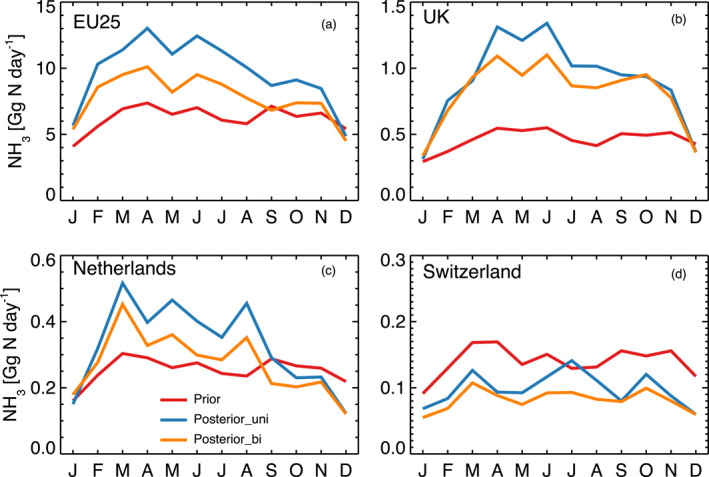
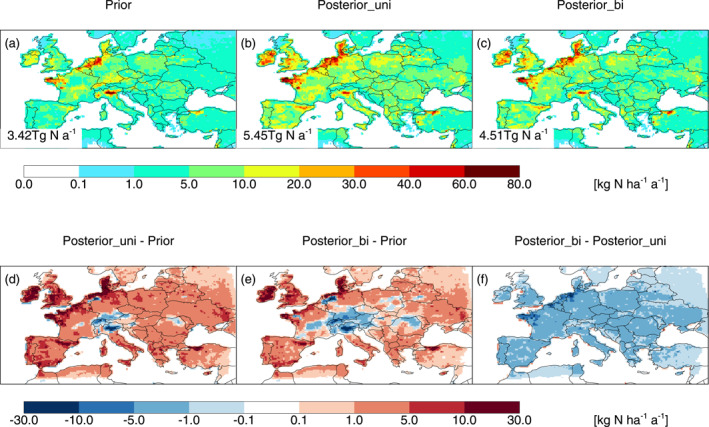
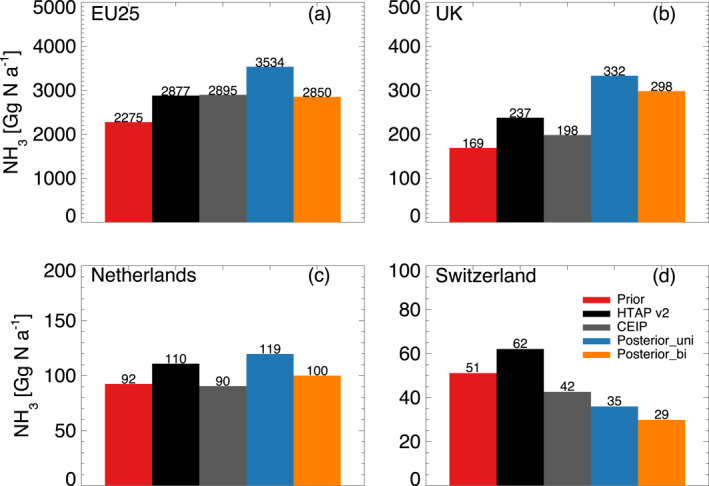
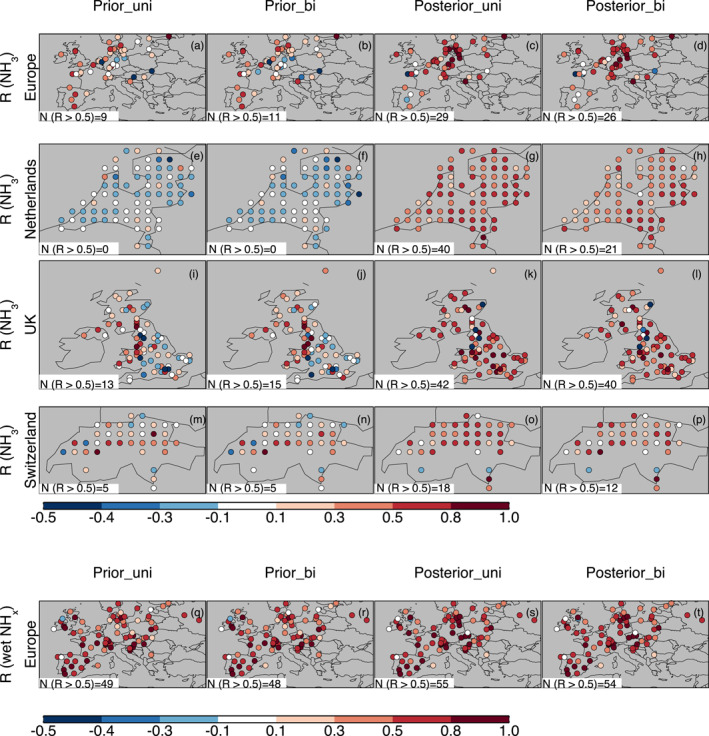
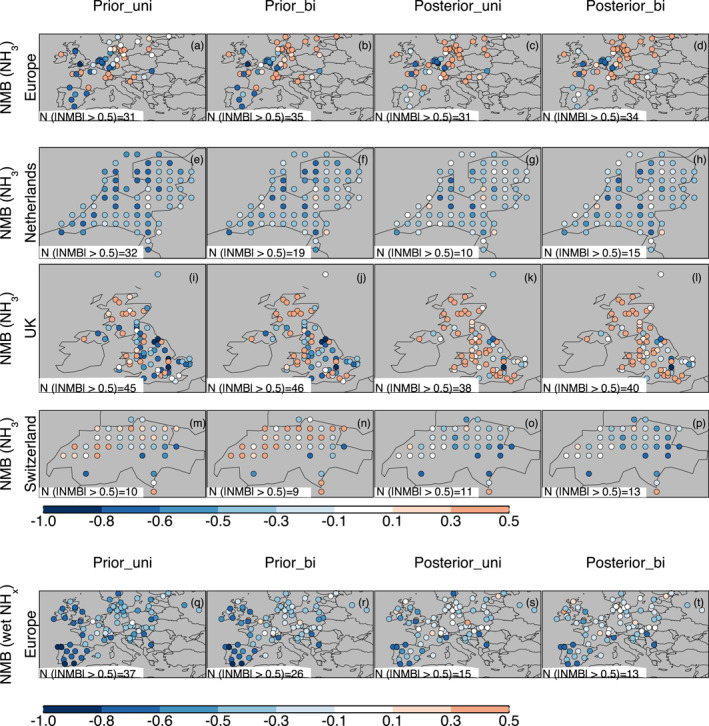
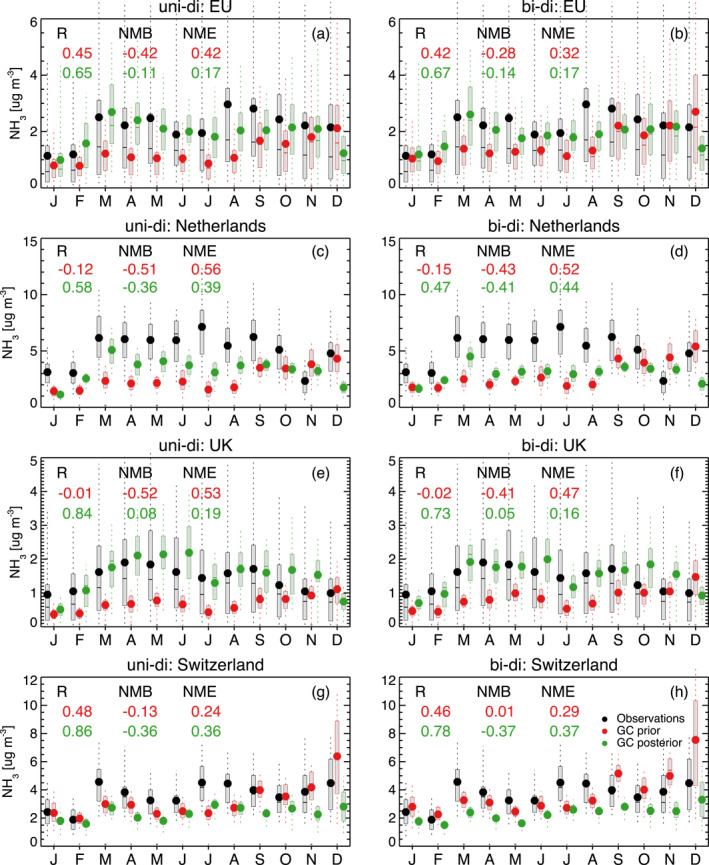
We conduct the first 4D-Var inversion of NH accounting for NH bi-directional flux, using CrIS satellite NH observations over Europe in 2016. We find posterior NH emissions peak more in springtime than prior emissions at continental to national scales, and annually they are generally smaller than the prior emissions over central Europe, but larger over most of the rest of Europe. Annual posterior anthropogenic NH emissions for 25 European Union members (EU25) are 25% higher than the prior emissions and very close (<2% difference) to other inventories. Our posterior annual anthropogenic emissions for EU25, the UK, the Netherlands, and Switzerland are generally 10%-20% smaller than when treating NH fluxes as uni-directional emissions, while the monthly regional difference can be up to 34% (Switzerland in July). Compared to monthly mean in-situ observations, our posterior NH emissions from both schemes generally improve the magnitude and seasonality of simulated surface NH and bulk NH wet deposition throughout most of Europe, whereas evaluation against hourly measurements at a background site shows the bi-directional scheme better captures observed diurnal variability of surface NH. This contrast highlights the need for accurately simulating diurnal variability of NH in assimilation of sun-synchronous observations and also the potential value of future geostationary satellite observations. Overall, our top-down ammonia emissions can help to examine the effectiveness of air pollution control policies to facilitate future air pollution management, as well as helping us understand the uncertainty in top-down NH emissions estimates associated with treatment of NH surface exchange.

摘要

我们利用2016年欧洲上空的CrIS卫星对氨(NH)的观测数据,进行了首次考虑NH双向通量的4D-Var反演。我们发现,在大陆到国家尺度上,春季的后验NH排放量峰值比先验排放量更高,并且从年度来看,它们在中欧地区通常比先验排放量小,但在欧洲其他大部分地区则更大。25个欧盟成员国(EU25)的年度后验人为NH排放量比先验排放量高25%,并且与其他清单非常接近(差异<2%)。我们对EU25、英国、荷兰和瑞士的后验年度人为排放量,通常比将NH通量视为单向排放时小10%-20%,而月度区域差异可达34%(7月的瑞士)。与月度平均实地观测相比,我们两种方案的后验NH排放量在欧洲大部分地区通常都改善了模拟的地表NH和大气NH湿沉降的量级和季节性,而在一个背景站点与每小时测量值进行评估时,双向方案能更好地捕捉到观测到的地表NH日变化。这种对比凸显了在同化太阳同步观测中准确模拟NH日变化的必要性,以及未来地球静止卫星观测的潜在价值。总体而言,我们的自上而下的氨排放量有助于检验空气污染控制政策的有效性,以促进未来的空气污染管理,同时也有助于我们了解与NH地表交换处理相关的自上而下NH排放量估计中的不确定性。

https://cdn.ncbi.nlm.nih.gov/pmc/blobs/3893/9286853/1ebae19c813c/JGRD-127-0-g008.jpg
https://cdn.ncbi.nlm.nih.gov/pmc/blobs/3893/9286853/041e622794c9/JGRD-127-0-g004.jpg
https://cdn.ncbi.nlm.nih.gov/pmc/blobs/3893/9286853/088c17053ca0/JGRD-127-0-g001.jpg
https://cdn.ncbi.nlm.nih.gov/pmc/blobs/3893/9286853/f61383fb4a27/JGRD-127-0-g009.jpg
https://cdn.ncbi.nlm.nih.gov/pmc/blobs/3893/9286853/1763c7f2a9f9/JGRD-127-0-g011.jpg
https://cdn.ncbi.nlm.nih.gov/pmc/blobs/3893/9286853/fe7065ef8ee1/JGRD-127-0-g005.jpg
https://cdn.ncbi.nlm.nih.gov/pmc/blobs/3893/9286853/23b08f1f22a0/JGRD-127-0-g007.jpg
https://cdn.ncbi.nlm.nih.gov/pmc/blobs/3893/9286853/adaebab0173a/JGRD-127-0-g006.jpg
https://cdn.ncbi.nlm.nih.gov/pmc/blobs/3893/9286853/cc2edb6d2a22/JGRD-127-0-g003.jpg
https://cdn.ncbi.nlm.nih.gov/pmc/blobs/3893/9286853/d2a3c387d220/JGRD-127-0-g002.jpg
https://cdn.ncbi.nlm.nih.gov/pmc/blobs/3893/9286853/e1c17abe5fb3/JGRD-127-0-g010.jpg
https://cdn.ncbi.nlm.nih.gov/pmc/blobs/3893/9286853/1ebae19c813c/JGRD-127-0-g008.jpg

相似文献

1
4D-Var Inversion of European NH Emissions Using CrIS NH Measurements and GEOS-Chem Adjoint With Bi-Directional and Uni-Directional Flux Schemes.利用CrIS氮氧化物测量数据和GEOS-Chem伴随模式与双向和单向通量方案对欧洲氮氧化物排放进行4D-Var反演
J Geophys Res Atmos. 2022 May 16;127(9):e2021JD035687. doi: 10.1029/2021JD035687. Epub 2022 May 6.
2
Hybrid Mass Balance/4D-Var Joint Inversion of NO and SO Emissions in East Asia.东亚地区氮氧化物和二氧化硫排放的混合质量平衡/四维变分联合反演
J Geophys Res Atmos. 2019 Jul 27;124(14):8203-8224. doi: 10.1029/2018JD030240. Epub 2019 Jul 29.
3
Quantifying global terrestrial methanol emissions using observations from the TES satellite sensor.利用对流层排放光谱仪(TES)卫星传感器的观测数据量化全球陆地甲醇排放量。
Atmos Chem Phys. 2014 Mar;14(5):2555-2570. doi: 10.5194/acp-14-2555-2014. Epub 2014 Mar 13.
4
Sector-Based Top-Down Estimates of NO , SO, and CO Emissions in East Asia.基于部门的东亚地区氮氧化物、二氧化硫和一氧化碳排放自上而下估算
Geophys Res Lett. 2022 Jan 28;49(2):e2021GL096009. doi: 10.1029/2021GL096009. Epub 2022 Jan 20.
5
An Inversion Framework for Optimizing Non-Methane VOC Emissions Using Remote Sensing and Airborne Observations in Northeast Asia During the KORUS-AQ Field Campaign.在“美韩空气质量(KORUS-AQ)”野外考察期间,利用东北亚地区的遥感和航空观测优化非甲烷挥发性有机化合物排放的反演框架
J Geophys Res Atmos. 2022 Apr 16;127(7):e2021JD035844. doi: 10.1029/2021JD035844. Epub 2022 Apr 12.
6
A Global Synthesis Inversion Analysis of Recent Variability in CO Fluxes Using GOSAT and In Situ Observations.利用GOSAT和实地观测对CO通量近期变化进行的全球综合反演分析
Atmos Chem Phys. 2018 Aug;18(15):11097-11124. doi: 10.5194/acp-18-11097-2018. Epub 2018 Aug 9.
7
Improved Inversion of Monthly Ammonia Emissions in China Based on the Chinese Ammonia Monitoring Network and Ensemble Kalman Filter.基于中国氨监测网络和集合卡尔曼滤波的中国逐月氨排放反演改进。
Environ Sci Technol. 2019 Nov 5;53(21):12529-12538. doi: 10.1021/acs.est.9b02701. Epub 2019 Oct 16.
8
SO Emission Estimates Using OMI SO Retrievals for 2005-2017.利用2005 - 2017年OMI二氧化硫反演数据估算二氧化硫排放量
J Geophys Res Atmos. 2019 Jul 27;124(14):8336-8359. doi: 10.1029/2019JD030243. Epub 2019 Jul 31.
9
Global estimates of dry ammonia deposition inferred from space-measurements.基于空间测量推断的全球干燥氨气沉降估算。
Sci Total Environ. 2020 Aug 15;730:139189. doi: 10.1016/j.scitotenv.2020.139189. Epub 2020 May 3.
10
Developing seasonal ammonia emission estimates with an inverse modeling technique.运用反演建模技术制定季节性氨排放估算值。
ScientificWorldJournal. 2001 Nov 21;1 Suppl 2:356-62. doi: 10.1100/tsw.2001.312.

本文引用的文献

1
Monthly Patterns of Ammonia Over the Contiguous United States at 2-km Resolution.美国本土2公里分辨率下氨的月度分布模式。
Geophys Res Lett. 2021 Mar 8;48(5). doi: 10.1029/2020gl090579.
2
New Bidirectional Ammonia Flux Model in an Air Quality Model Coupled With an Agricultural Model.空气质量模型与农业模型耦合中的新型双向氨通量模型
J Adv Model Earth Syst. 2019 Oct 24;11(9):2934-2957. doi: 10.1029/2019MS001728.
3
Maximizing US nitrate removal through wetland protection and restoration.通过湿地保护和修复实现美国硝酸盐去除的最大化。
Nature. 2020 Dec;588(7839):625-630. doi: 10.1038/s41586-020-03042-5. Epub 2020 Dec 16.
4
Alkaline air: changing perspectives on nitrogen and air pollution in an ammonia-rich world.碱性空气:富含氨的世界中对氮和空气污染的观点转变。
Philos Trans A Math Phys Eng Sci. 2020 Oct 30;378(2183):20190315. doi: 10.1098/rsta.2019.0315. Epub 2020 Sep 28.
5
Societal benefits of halving agricultural ammonia emissions in China far exceed the abatement costs.在中国将农业氨气排放量减少一半将带来巨大的社会效益,远远超过减排成本。
Nat Commun. 2020 Aug 31;11(1):4357. doi: 10.1038/s41467-020-18196-z.
6
High resolution temporal profiles in the Emissions Database for Global Atmospheric Research.全球大气研究排放数据库中的高时间分辨率时间剖面。
Sci Data. 2020 Apr 17;7(1):121. doi: 10.1038/s41597-020-0462-2.
7
Investigating ammonia emissions in a coastal urban airshed using stable isotope techniques.利用稳定同位素技术研究沿海城市大气中氨的排放。
Sci Total Environ. 2020 Mar 10;707:134952. doi: 10.1016/j.scitotenv.2019.134952. Epub 2019 Dec 3.
8
Nitrogen crisis threatens Dutch environment-and economy.氮危机威胁荷兰环境与经济。
Science. 2019 Dec 6;366(6470):1180-1181. doi: 10.1126/science.366.6470.1180.
9
Improved Inversion of Monthly Ammonia Emissions in China Based on the Chinese Ammonia Monitoring Network and Ensemble Kalman Filter.基于中国氨监测网络和集合卡尔曼滤波的中国逐月氨排放反演改进。
Environ Sci Technol. 2019 Nov 5;53(21):12529-12538. doi: 10.1021/acs.est.9b02701. Epub 2019 Oct 16.
10
Long-Term Trend of Gaseous Ammonia Over the United States: Modeling and Comparison With Observations.
J Geophys Res Atmos. 2018 Aug 16;123(15):8315-8325. doi: 10.1029/2018JD028412. Epub 2018 Aug 12.