Luo Yu, Jiang Han, Meng Nan, Huang Zhun, Li Ziqiang, Feng Pengyang, Fang Ting, Fu Fangfang, Yuan Jianmin, Wang Zhe, Yang Yang, Wang Meiyun
Department of Medical Imaging, Zhengzhou University People's Hospital & Henan Provincial People's Hospital, Zhengzhou, China.
Academy of Medical Sciences, Zhengzhou University, Zhengzhou, China.
Front Oncol. 2022 Jul 21;12:907860. doi: 10.3389/fonc.2022.907860. eCollection 2022.
To evaluate the application value of monoexponential, fractional order calculus (FROC) diffusion models and PET imaging to distinguish between benign and malignant solitary pulmonary lesions (SPLs) and malignant SPLs with different pathological types and explore the correlation between each parameter and Ki67 expression.
A total of 112 patients were enrolled in this study. Prior to treatment, all patients underwent a dedicated thoracic F-FDG PET/MR examination. Five parameters [including apparent diffusion coefficient (ADC) derived from the monoexponential model; diffusion coefficient (D), a microstructural quantity (μ), and fractional order parameter (β) derived from the FROC model and maximum standardized uptake value (SUVmax) derived from PET] were compared between benign and malignant SPLs and different pathological types of malignant SPLs. Independent sample t test, Mann-Whitney U test, DeLong test and receiver operating characteristic (ROC) curve analysis were used for statistical evaluation. Pearson correlation analysis was used to calculate the correlations between Ki-67 and ADC, D, μ, β, and SUVmax.
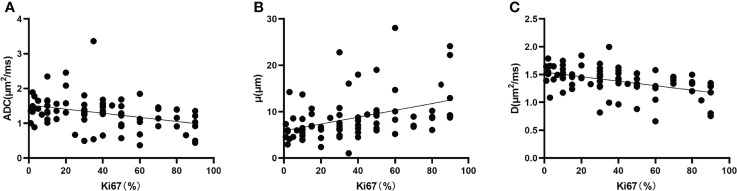
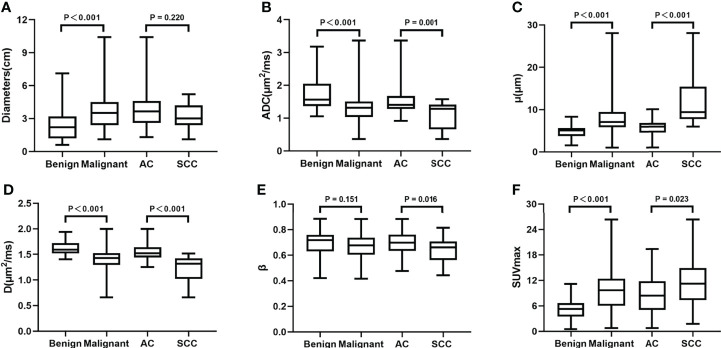
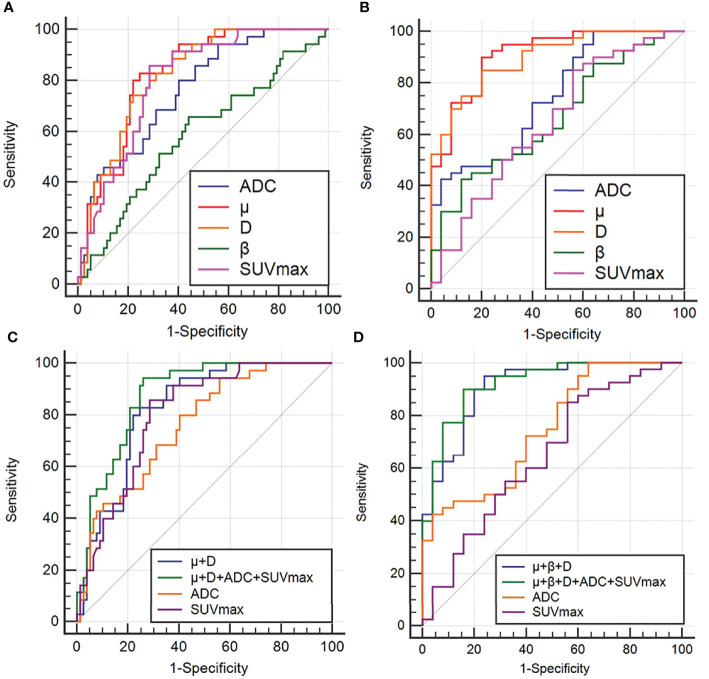
The ADC and D values were significantly higher and the μ and SUVmax values were significantly lower in the benign group [1.57 (1.37, 2.05) μm/ms, 1.59 (1.52, 1.72) μm/ms, 5.06 (3.76, 5.66) μm, 5.15 ± 2.60] than in the malignant group [1.32 (1.03, 1.51) μm/ms, 1.43 (1.29, 1.52) μm/ms, 7.06 (5.87, 9.45) μm, 9.85 ± 4.95]. The ADC, D and β values were significantly lower and the μ and SUVmax values were significantly higher in the squamous cell carcinoma (SCC) group [1.29 (0.66, 1.42) μm/ms, 1.32 (1.02, 1.42) μm/ms, 0.63 ± 0.10, 9.40 (7.76, 15.38) μm, 11.70 ± 5.98] than in the adenocarcinoma (AC) group [1.40 (1.28, 1.67) μm/ms, 1.52 (1.44, 1.64) μm/ms, 0.70 ± 0.10, 5.99 (4.54, 6.87) μm, 8.76 ± 4.18]. ROC curve analysis showed that for a single parameter, μ exhibited the best AUC value in discriminating between benign and malignant SPLs groups and AC and SCC groups (AUC = 0.824 and 0.911, respectively). Importantly, the combination of monoexponential, FROC models and PET imaging can further improve diagnostic performance (AUC = 0.872 and 0.922, respectively). The Pearson correlation analysis showed that Ki67 was positively correlated with μ value and negatively correlated with ADC and D values (r = 0.402, -0.346, -0.450, respectively).
The parameters D and μ derived from the FROC model were superior to ADC and SUVmax in distinguishing benign from malignant SPLs and adenocarcinoma from squamous cell carcinoma, in addition, the combination of multiple parameters can further improve diagnostic performance. The non-Gaussian FROC diffusion model is expected to become a noninvasive quantitative imaging technique for identifying SPLs.
评估单指数、分数阶微积分(FROC)扩散模型及PET成像在鉴别良性与恶性孤立性肺结节(SPL)以及不同病理类型的恶性SPL中的应用价值,并探讨各参数与Ki67表达之间的相关性。
本研究共纳入112例患者。治疗前,所有患者均接受了专门的胸部F-FDG PET/MR检查。比较了良性与恶性SPL以及不同病理类型的恶性SPL之间的五个参数[包括从单指数模型得出的表观扩散系数(ADC);从FROC模型得出的扩散系数(D)、微观结构量(μ)和分数阶参数(β)以及从PET得出的最大标准化摄取值(SUVmax)]。采用独立样本t检验、Mann-Whitney U检验、DeLong检验和受试者工作特征(ROC)曲线分析进行统计学评估。采用Pearson相关分析计算Ki-67与ADC、D、μ、β和SUVmax之间的相关性。
良性组的ADC和D值显著高于恶性组[1.57(1.37,2.05)μm/ms,1.59(1.52,1.72)μm/ms,5.06(3.76,5.66)μm,5.15±2.60],而μ和SUVmax值显著低于恶性组[1.32(1.03,1.51)μm/ms,1.43(1.29,1.52)μm/ms,7.06(5.87,9.45)μm,9.85±4.95]。鳞状细胞癌(SCC)组的ADC、D和β值显著低于腺癌(AC)组[1.29(0.66,1.42)μm/ms,1.32(1.02,1.42)μm/ms,0.63±0.10,9.40(7.76,15.38)μm,11.70±5.98],而μ和SUVmax值显著高于AC组[1.40(1.28,1.67)μm/ms,1.52(1.44,1.64)μm/ms,0.70±0.10,5.99(4.54,6.87)μm,8.76±4.18]。ROC曲线分析表明,对于单个参数,μ在鉴别良性与恶性SPL组以及AC与SCC组中表现出最佳的AUC值(分别为AUC = 0.824和0.911)。重要的是,单指数、FROC模型和PET成像的联合应用可进一步提高诊断性能(分别为AUC = 0.872和0.922)。Pearson相关分析表明,Ki67与μ值呈正相关,与ADC和D值呈负相关(r分别为0.402、-0.346、-0.450)。
FROC模型得出的参数D和μ在鉴别良性与恶性SPL以及腺癌与鳞状细胞癌方面优于ADC和SUVmax,此外,多个参数的联合应用可进一步提高诊断性能。非高斯FROC扩散模型有望成为一种用于识别SPL的非侵入性定量成像技术。