University of Minnesota, Minneapolis, MN, USA.
Inquiry. 2023 Jan-Dec;60:469580231155988. doi: 10.1177/00469580231155988.
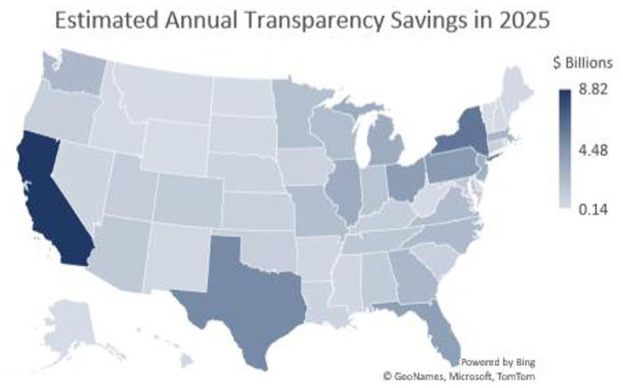
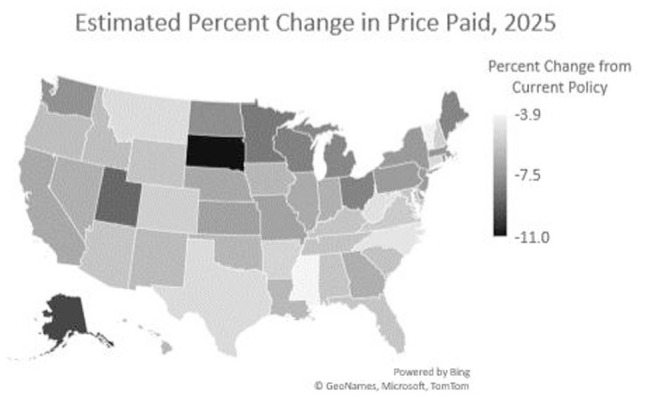
This analysis investigates and scores the impact of new health price transparency rules. Using a set of novel data sources, we estimate substantial savings are possible following the implementation of the insurer price transparency rule. Specifically, we estimate annual savings to consumers, employers, and insurers by 2025, assuming a robust set of tools to allow consumers to purchase medical services. We matched claims with 70 HHS defined shoppable services by CPT and DRG codes and replaced them with an estimated median commercial allowed payment multiplied by a reduced cost of 40% based on estimates found from literature for the difference in cost between negotiated and cash payment for medical services. We consider 40% to be an upper bound estimate of the potential savings based on existing literature. Several databases are used to estimate the potential benefits of insurer price transparency. Two different all-payer claim databases were used, representing the entire insured population in the US. For this analysis, only the private insurer commercial population was examined, comprised of over 200 million covered lives as of 2021. The estimated impact of price transparency will vary significantly by region and income level. The national upper bound estimate is $80.7 billion. The national lower bound estimate is $17.6 billion. For the upper bound, the region with the most significant impact in the US will be the Midwest, with $20 billion in potential savings and an 8% reduction in medical expenditure. The region with the lowest impact will be the South, with only a 5.8% reduction. Concerning income, those at lower levels of income will have the most significant impact with a -7.4% (<100% Federal Poverty Level) to -7.5% (100%-137% Federal Poverty Level) impact. Overall, the total impact could be a 6.9% reduction for the whole privately insured population in the United States. In summary, a unique set of national data resources were used to estimate the cost savings impact medical price transparency. This analysis suggests price transparency for shoppable services may yields significant savings between $17.6 to $80.7 billion by 2025. Consumers may have strong incentives to shop with the rise in the use of high deductibles, health plans, and health savings accounts. How these potential saving are to be shared by consumers, employers and health plans has yet to be determined.
本分析研究并评估了新的医疗价格透明度规则的影响。使用一组新的数据源,我们估计在实施保险公司价格透明度规则后,可能会实现大量节省。具体来说,我们根据一系列允许消费者购买医疗服务的强大工具,估计了 2025 年消费者、雇主和保险公司的年度节省。我们将索赔与 HHS 定义的 70 项可购物服务进行匹配,并根据文献中发现的关于医疗服务协商支付和现金支付之间成本差异的估计,用估计的中位数商业可支付金额乘以 40%的降低成本进行替换。我们认为基于现有文献,40%是潜在节省的上限估计。使用了几个数据库来估计保险公司价格透明度的潜在收益。使用了两个不同的全支付者索赔数据库,代表美国的整个参保人群。在这项分析中,仅检查了私人保险公司商业人群,截至 2021 年,该人群覆盖了超过 2 亿人。价格透明度的估计影响将因地区和收入水平而异。全国上限估计为 807 亿美元。全国下限估计为 176 亿美元。对于上限,美国影响最大的地区将是中西部,潜在节省 200 亿美元,医疗支出减少 8%。影响最小的地区将是南部,仅减少 5.8%。关于收入,收入水平较低的人群受影响最大,降幅为-7.4%(低于联邦贫困线 100%)至-7.5%(联邦贫困线 100%-137%)。总体而言,美国整个私人保险人群的总影响可能降低 6.9%。总之,使用了一组独特的国家数据资源来估计医疗价格透明度的成本节约影响。这项分析表明,对于可购物服务的价格透明度,到 2025 年,可能会产生 176 亿至 807 亿美元的节省。随着高免赔额、健康计划和健康储蓄账户的使用增加,消费者可能会有强烈的购物动机。这些潜在的节省将如何在消费者、雇主和健康计划之间分配,还有待确定。