• 文献检索
  • 文档翻译
  • 深度研究
  • 学术资讯
  • Suppr Zotero 插件Zotero 插件
  • 邀请有礼
  • 套餐&价格
  • 历史记录
应用&插件
Suppr Zotero 插件Zotero 插件浏览器插件Mac 客户端Windows 客户端微信小程序
定价
高级版会员购买积分包购买API积分包
服务
文献检索文档翻译深度研究API 文档MCP 服务
关于我们
关于 Suppr公司介绍联系我们用户协议隐私条款
关注我们

Suppr 超能文献

核心技术专利:CN118964589B侵权必究
粤ICP备2023148730 号-1Suppr @ 2026

文献检索

告别复杂PubMed语法,用中文像聊天一样搜索,搜遍4000万医学文献。AI智能推荐,让科研检索更轻松。

立即免费搜索

文件翻译

保留排版,准确专业,支持PDF/Word/PPT等文件格式,支持 12+语言互译。

免费翻译文档

深度研究

AI帮你快速写综述,25分钟生成高质量综述,智能提取关键信息,辅助科研写作。

立即免费体验

一个长达百年的中国均质化每日地表气温数据集(CUG-CMA CHDT)。

A century-long China homogenized daily surface air temperature dataset (CUG-CMA CHDT).

作者信息

Zheng Xiang, Ren Yuyu, Ren Guoyu, Zhang Panfeng, He Jiajun, Yang Guowei, Qin Yun, Wen Kangmin, Xue Xiaoying, Ren Chenchen

机构信息

Department of Atmospheric Science, School of Environmental Studies, China University of Geosciences, Wuhan, 430074, China.

National Climate Center, China Meteorological Administration, Beijing, 100000, China.

出版信息

Sci Data. 2024 Sep 27;11(1):1045. doi: 10.1038/s41597-024-03758-3.

DOI:10.1038/s41597-024-03758-3
PMID:39333104
原文链接:https://pmc.ncbi.nlm.nih.gov/articles/PMC11436746/
Abstract

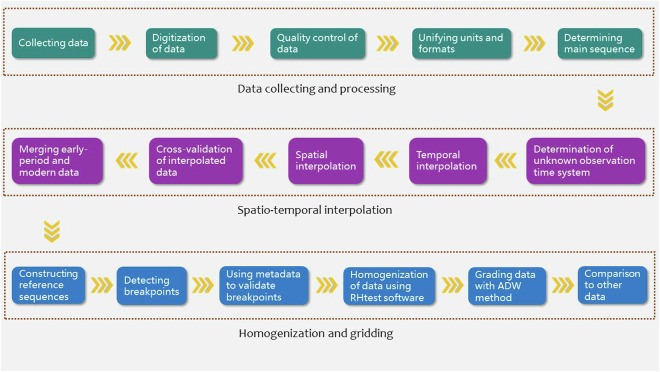
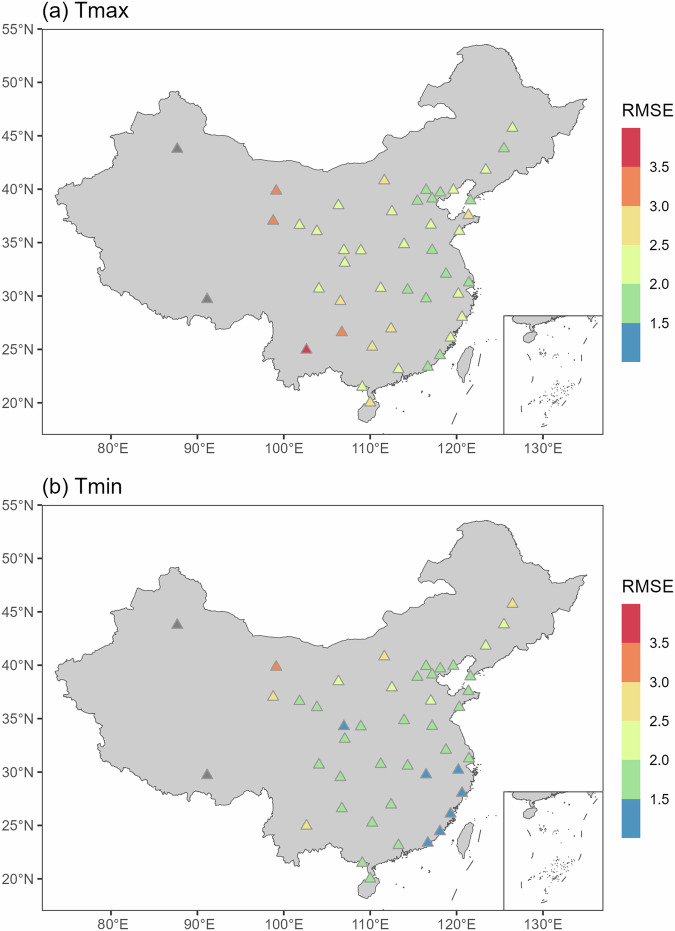
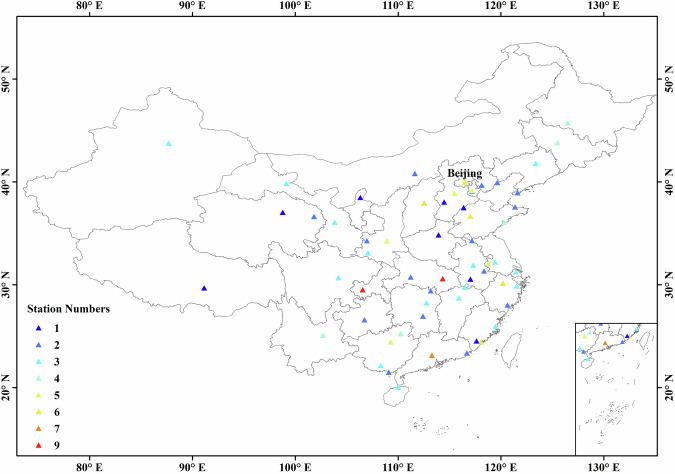
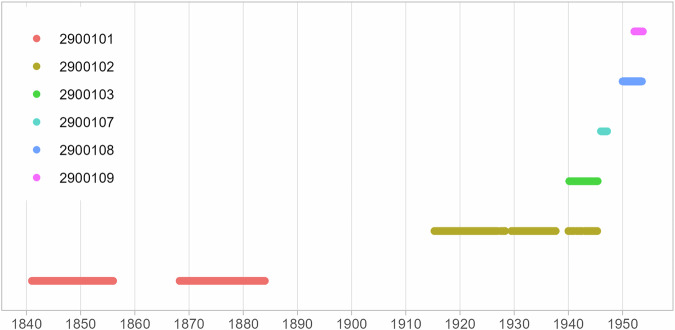
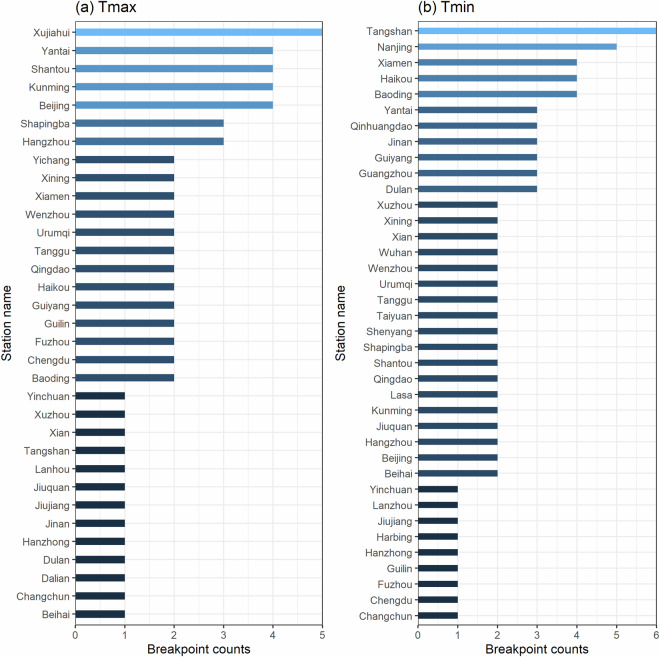
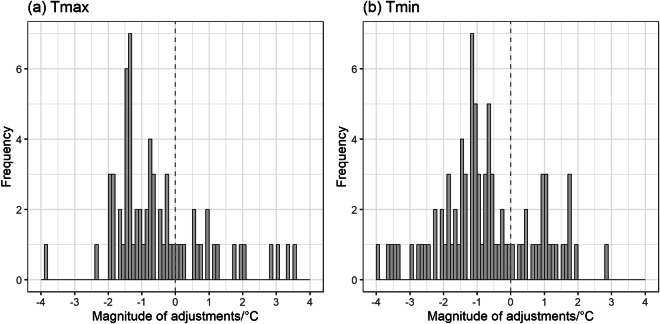
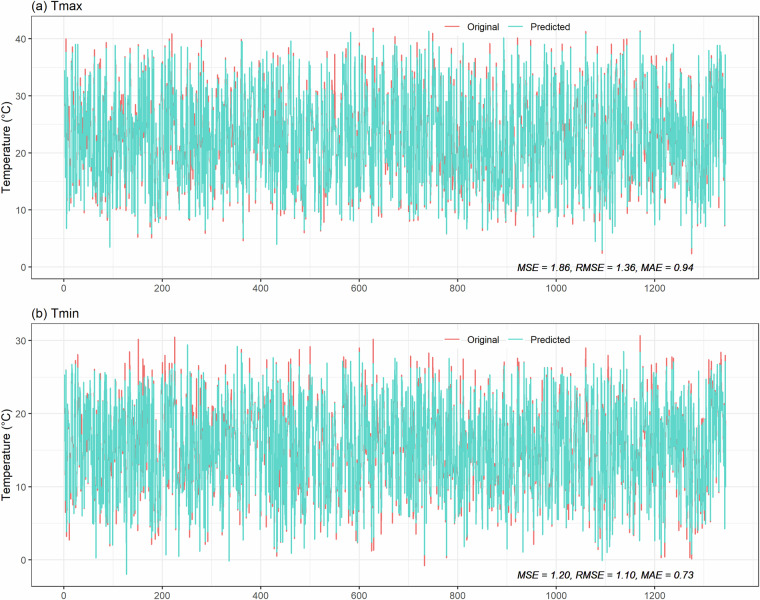
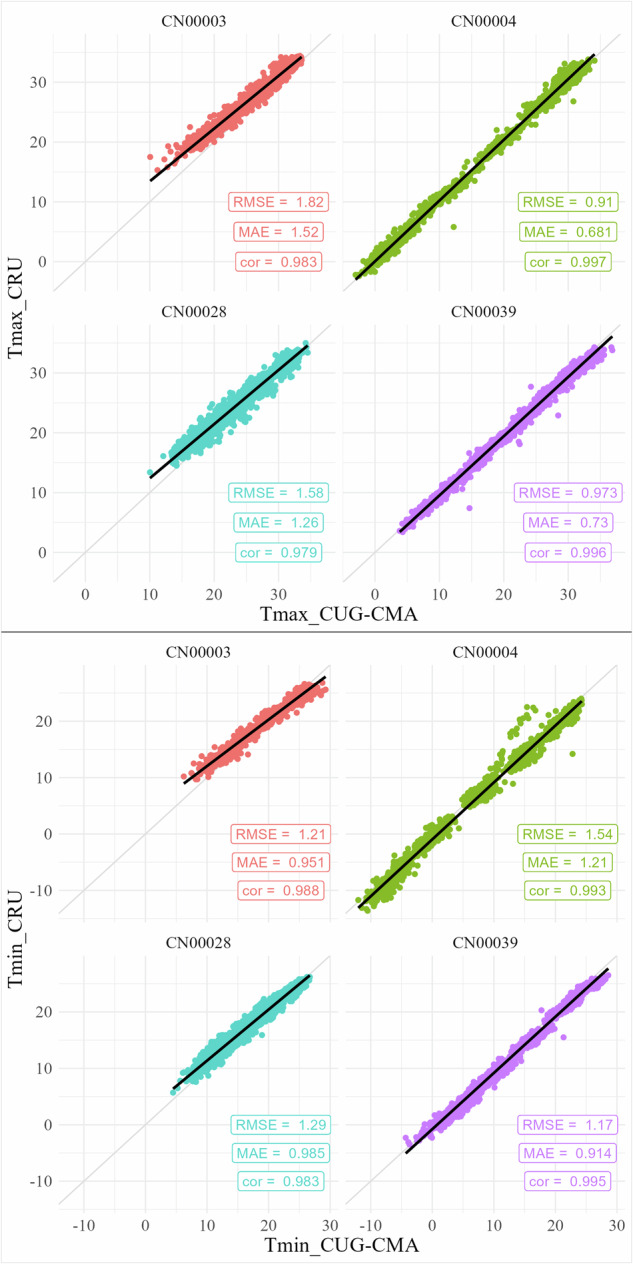
Daily meteorological observation data of the early period (pre-1950) were critically important for investigating the long-term trends and multi-decadal scale variability of extreme climate events. The high-resolution surface air temperature (SAT) data for time period before 1950 are lacking in China. We extended the SAT observations of China back to 1840 through developing a pre-1950 daily SAT dataset. The early-period daily SAT were manually corrected for the input and clerical errors, and then according to the length or coverage of time, the main series for each of the cities was determined. The observation time system of unknown sites was determined by the minimum difference method. After these operations, the data of all sites were unified into the same format. By using the ridge regressions established based on data from modern reference stations, the missing maximum temperature (Tmax) and minimum temperature (Tmin) were interpolated. The early-period data were combined with modern data to form the long-term daily SAT dataset of 1840-2020 in China. RHtest software was used to detect and adjust the inhomogeneities in the station data series. Finally, the century-long homogenized daily SAT dataset including 45 key city stations in China was obtained. Among the stations, there are 20 stations with observation record more than one hundred years. The length of temperature observation series of 17 stations is between 80 and 100 years. The series length of the remaining 7 stations is between 68 and 80 years. Finally, the angular distance weighting (ADW) method was used to interpolate the data into grid products, and the grid size is 2.5 ° × 2.5 °. The dataset was named CUG-CMA CHDT, which is applicable in monitoring, studies and assessments of regional extreme temperature change and variability in China.

摘要

早期(1950年以前)的每日气象观测数据对于研究极端气候事件的长期趋势和年代际尺度变化至关重要。中国缺乏1950年以前时间段的高分辨率地面气温(SAT)数据。我们通过开发一个1950年以前的每日SAT数据集,将中国的SAT观测回溯到了1840年。对早期每日SAT数据进行人工校正,以消除输入和记录错误,然后根据时间长度或覆盖范围,确定每个城市的主要序列。未知站点的观测时间系统通过最小差值法确定。经过这些操作,所有站点的数据被统一为相同格式。利用基于现代参考站数据建立的岭回归,对缺失的最高温度(Tmax)和最低温度(Tmin)进行插值。将早期数据与现代数据相结合,形成了中国1840 - 2020年的长期每日SAT数据集。使用RHtest软件检测和调整站点数据序列中的不均匀性。最终,获得了包含中国45个重点城市站点的长达一个世纪的均匀化每日SAT数据集。其中,有20个站点的观测记录超过100年。17个站点的气温观测序列长度在80至100年之间。其余7个站点的序列长度在68至80年之间。最后,采用角距离加权(ADW)方法将数据插值为网格产品,网格大小为2.5°×2.5°。该数据集命名为CUG - CMA CHDT,适用于中国区域极端温度变化和变率的监测、研究与评估。

https://cdn.ncbi.nlm.nih.gov/pmc/blobs/83f3/11436746/81ace305865a/41597_2024_3758_Fig14_HTML.jpg
https://cdn.ncbi.nlm.nih.gov/pmc/blobs/83f3/11436746/803fa100cff4/41597_2024_3758_Fig1_HTML.jpg
https://cdn.ncbi.nlm.nih.gov/pmc/blobs/83f3/11436746/a7b085e5484e/41597_2024_3758_Fig2_HTML.jpg
https://cdn.ncbi.nlm.nih.gov/pmc/blobs/83f3/11436746/6d6abcf59967/41597_2024_3758_Fig3_HTML.jpg
https://cdn.ncbi.nlm.nih.gov/pmc/blobs/83f3/11436746/922fad52cb4e/41597_2024_3758_Fig4_HTML.jpg
https://cdn.ncbi.nlm.nih.gov/pmc/blobs/83f3/11436746/8c1e6855282d/41597_2024_3758_Fig5_HTML.jpg
https://cdn.ncbi.nlm.nih.gov/pmc/blobs/83f3/11436746/9c5793565482/41597_2024_3758_Fig6_HTML.jpg
https://cdn.ncbi.nlm.nih.gov/pmc/blobs/83f3/11436746/93c3024e77bd/41597_2024_3758_Fig7_HTML.jpg
https://cdn.ncbi.nlm.nih.gov/pmc/blobs/83f3/11436746/6c8c349c637e/41597_2024_3758_Fig8_HTML.jpg
https://cdn.ncbi.nlm.nih.gov/pmc/blobs/83f3/11436746/77ab4dc0a17d/41597_2024_3758_Fig9_HTML.jpg
https://cdn.ncbi.nlm.nih.gov/pmc/blobs/83f3/11436746/6c150d54b77f/41597_2024_3758_Fig10_HTML.jpg
https://cdn.ncbi.nlm.nih.gov/pmc/blobs/83f3/11436746/e41f894ddc4c/41597_2024_3758_Fig11_HTML.jpg
https://cdn.ncbi.nlm.nih.gov/pmc/blobs/83f3/11436746/c193d5271477/41597_2024_3758_Fig12_HTML.jpg
https://cdn.ncbi.nlm.nih.gov/pmc/blobs/83f3/11436746/fd4ccd6e7c33/41597_2024_3758_Fig13_HTML.jpg
https://cdn.ncbi.nlm.nih.gov/pmc/blobs/83f3/11436746/81ace305865a/41597_2024_3758_Fig14_HTML.jpg

相似文献

1
A century-long China homogenized daily surface air temperature dataset (CUG-CMA CHDT).一个长达百年的中国均质化每日地表气温数据集(CUG-CMA CHDT)。
Sci Data. 2024 Sep 27;11(1):1045. doi: 10.1038/s41597-024-03758-3.
2
Dataset of gridded time series of monthly air temperature (min, max, mean) and atmospheric precipitation for Ukraine covering the period of 1946-2020.乌克兰1946 - 2020年期间月气温(最低、最高、平均)和大气降水的网格化时间序列数据集。
Data Brief. 2022 Aug 24;44:108553. doi: 10.1016/j.dib.2022.108553. eCollection 2022 Oct.
3
Reconstruction of all-sky daily air temperature datasets with high accuracy in China from 2003 to 2022.2003年至2022年中国高精度全天每日气温数据集的重建
Sci Data. 2024 Oct 15;11(1):1133. doi: 10.1038/s41597-024-03980-z.
4
[Establishment of a complete daily time series of precipitation and its change characteristics in forest region of eastern China during 1961-2010].[1961—2010年中国东部林区降水完整日时间序列的建立及其变化特征]
Ying Yong Sheng Tai Xue Bao. 2013 Apr;24(4):1047-54.
5
Monitoring climate at Jungfraujoch in the high Swiss Alpine region.监测瑞士阿尔卑斯山区少女峰的气候。
Sci Total Environ. 2008 Mar 1;391(2-3):262-8. doi: 10.1016/j.scitotenv.2007.10.005. Epub 2007 Nov 28.
6
High-resolution spatiotemporal modeling of daily near-surface air temperature in Germany over the period 2000-2020.2000 - 2020年德国近地表日气温的高分辨率时空建模
Environ Res. 2023 Feb 15;219:115062. doi: 10.1016/j.envres.2022.115062. Epub 2022 Dec 17.
7
Impact of the 1990 Hong Kong legislation for restriction on sulfur content in fuel.1990年香港燃料含硫量限制立法的影响。
Res Rep Health Eff Inst. 2012 Aug(170):5-91.
8
Hourly PWV Dataset Derived from GNSS Observations in China.基于中国 GNSS 观测的逐时 PWV 数据集。
Sensors (Basel). 2019 Dec 31;20(1):231. doi: 10.3390/s20010231.
9
The first high-resolution meteorological forcing dataset for land process studies over China.中国陆面过程研究的首个高分辨率气象强迫数据集。
Sci Data. 2020 Jan 21;7(1):25. doi: 10.1038/s41597-020-0369-y.
10
Merging framework for estimating daily surface air temperature by integrating observations from multiple polar-orbiting satellites.多颗极轨卫星观测资料融合估算逐日地面气温的融合框架。
Sci Total Environ. 2022 Mar 15;812:152538. doi: 10.1016/j.scitotenv.2021.152538. Epub 2021 Dec 23.