• 文献检索
  • 文档翻译
  • 深度研究
  • 学术资讯
  • Suppr Zotero 插件Zotero 插件
  • 邀请有礼
  • 套餐&价格
  • 历史记录
应用&插件
Suppr Zotero 插件Zotero 插件浏览器插件Mac 客户端Windows 客户端微信小程序
定价
高级版会员购买积分包购买API积分包
服务
文献检索文档翻译深度研究API 文档MCP 服务
关于我们
关于 Suppr公司介绍联系我们用户协议隐私条款
关注我们

Suppr 超能文献

核心技术专利:CN118964589B侵权必究
粤ICP备2023148730 号-1Suppr @ 2026

文献检索

告别复杂PubMed语法,用中文像聊天一样搜索,搜遍4000万医学文献。AI智能推荐,让科研检索更轻松。

立即免费搜索

文件翻译

保留排版,准确专业,支持PDF/Word/PPT等文件格式,支持 12+语言互译。

免费翻译文档

深度研究

AI帮你快速写综述,25分钟生成高质量综述,智能提取关键信息,辅助科研写作。

立即免费体验

利用有毒空气污染物监测数据追踪香港二十年间(2000 - 2020年)吸入性癌症风险和臭氧形成潜力的源变化

Tracking Source Variations of Inhalation Cancer Risks and Ozone Formation Potential in Hong Kong over Two Decades (2000-2020) Using Toxic Air Pollutant Monitoring Data.

作者信息

Wong Yee Ka, Chan Wai Wai, Gu Dasa, Yu Jian Zhen, Lau Alexis K H

机构信息

Division of Environment and Sustainability, The Hong Kong University of Science and Technology, Clear Water Bay, Kowloon, Hong Kong 000000, China.

Institute for the Environment, The Hong Kong University of Science and Technology, Clear Water Bay, Kowloon, Hong Kong 000000, China.

出版信息

Environ Health (Wash). 2024 May 23;2(6):411-421. doi: 10.1021/envhealth.3c00209. eCollection 2024 Jun 21.

DOI:10.1021/envhealth.3c00209
PMID:39473467
原文链接:https://pmc.ncbi.nlm.nih.gov/articles/PMC11504198/
Abstract

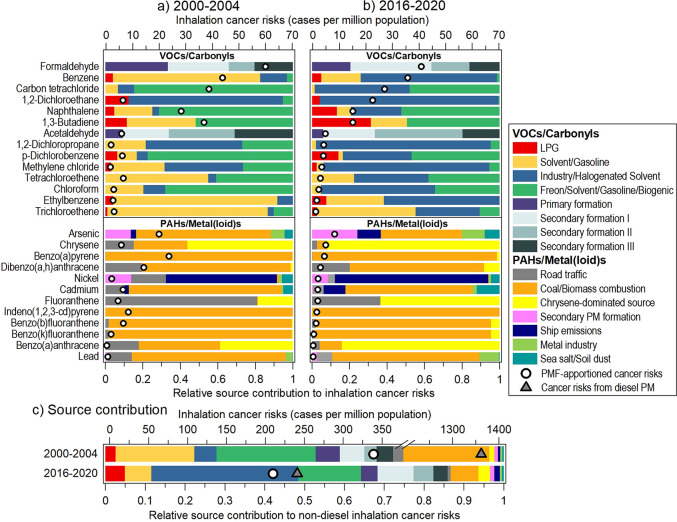
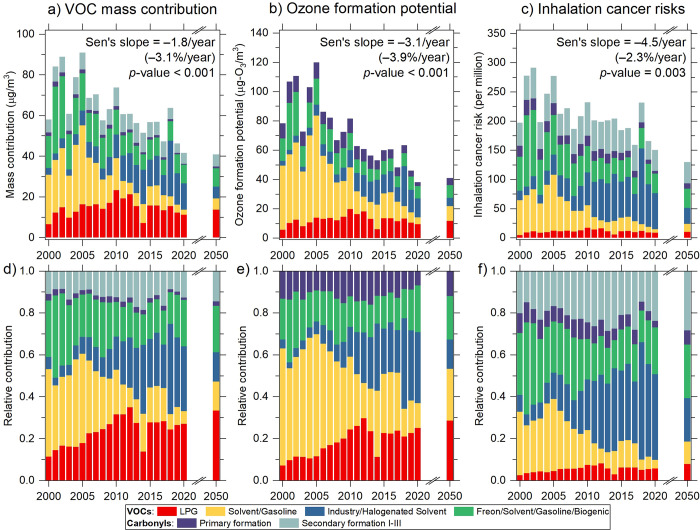
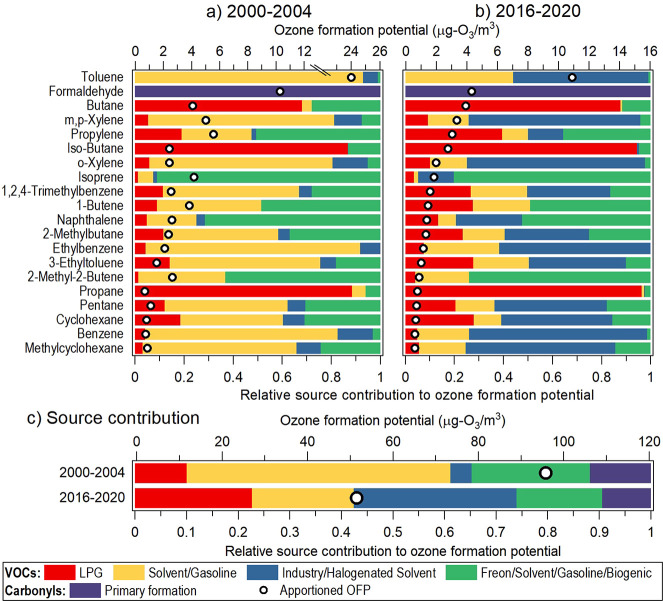
Toxic air pollutants (TAPs) are a class of airborne chemicals known or suspected to cause serious health issues. This study, applying positive matrix factorization and inhalation unit risk estimates of TAPs, quantifies the changes in significant sources contributing to inhalation cancer risks (ICRs) from 2000 to 2020 in Hong Kong, China. Total ICR decreased from 1701 to 451 cases per million between 2000-2004 and 2016-2020, largely attributed to the reduction in diesel particulate matter (DPM), gasoline and solvent use-related volatile organic compounds (VOCs), and coal/biomass combustion-related polycyclic aromatic hydrocarbons and metal(loid)s. The regional contribution of VOCs associated with industrial and halogenated solvent sources increased substantially, representing the largest non-DPM ICR contributor (37%) in 2016-2020, stressing the need for a more comprehensive risk evaluation across the fast-growing and densely populated Greater Bay Area (GBA). ICRs in Hong Kong and the GBA will likely remain over 100 cases per million by 2050. The contributions to ozone formation potential of VOC/carbonyl sources were quantified, which show a notable shift from being solvent/gasoline-dominant in 2000-2004 to being more evenly shared by various sources in 2016-2020. Establishing a similar TAP monitoring network in the GBA is anticipated to provide the monitoring data needed to facilitate the development of more informed air quality management strategies.

摘要

有毒空气污染物(TAPs)是一类已知或疑似会引发严重健康问题的空气传播化学物质。本研究运用正矩阵分解法和TAPs的吸入单位风险估计值,对2000年至2020年期间中国香港吸入性癌症风险(ICRs)的主要来源变化进行了量化。2000 - 2004年至2016 - 2020年期间,总ICR从每百万1701例降至451例,这主要归因于柴油颗粒物(DPM)、汽油和溶剂使用相关的挥发性有机化合物(VOCs)以及煤炭/生物质燃烧相关的多环芳烃和金属(类金属)的减少。与工业和卤代溶剂源相关的VOCs的区域贡献大幅增加,在2016 - 2020年成为最大的非DPM ICR贡献源(37%),这凸显了在快速发展且人口密集的大湾区(GBA)进行更全面风险评估的必要性。到2050年,香港和大湾区的ICRs可能仍将超过每百万100例。对VOC/羰基源对臭氧形成潜力的贡献进行了量化,结果显示从2000 - 2004年以溶剂/汽油为主导到2016 - 2020年各来源贡献更为均衡的显著转变。预计在大湾区建立类似的TAP监测网络将提供所需监测数据,以促进制定更明智的空气质量管理策略。

https://cdn.ncbi.nlm.nih.gov/pmc/blobs/5fac/11504198/b7e38ac20431/eh3c00209_0003.jpg
https://cdn.ncbi.nlm.nih.gov/pmc/blobs/5fac/11504198/ff5d88621438/eh3c00209_0001.jpg
https://cdn.ncbi.nlm.nih.gov/pmc/blobs/5fac/11504198/59e3a3b8fb80/eh3c00209_0002.jpg
https://cdn.ncbi.nlm.nih.gov/pmc/blobs/5fac/11504198/b7e38ac20431/eh3c00209_0003.jpg
https://cdn.ncbi.nlm.nih.gov/pmc/blobs/5fac/11504198/ff5d88621438/eh3c00209_0001.jpg
https://cdn.ncbi.nlm.nih.gov/pmc/blobs/5fac/11504198/59e3a3b8fb80/eh3c00209_0002.jpg
https://cdn.ncbi.nlm.nih.gov/pmc/blobs/5fac/11504198/b7e38ac20431/eh3c00209_0003.jpg

相似文献

1
Tracking Source Variations of Inhalation Cancer Risks and Ozone Formation Potential in Hong Kong over Two Decades (2000-2020) Using Toxic Air Pollutant Monitoring Data.利用有毒空气污染物监测数据追踪香港二十年间(2000 - 2020年)吸入性癌症风险和臭氧形成潜力的源变化
Environ Health (Wash). 2024 May 23;2(6):411-421. doi: 10.1021/envhealth.3c00209. eCollection 2024 Jun 21.
2
Real-World Vehicle Emissions Characterization for the Shing Mun Tunnel in Hong Kong and Fort McHenry Tunnel in the United States.香港城门隧道和美国麦克亨利堡隧道的实际车辆排放特征
Res Rep Health Eff Inst. 2019 Mar;2019(199):5-52.
3
Personal exposure to mixtures of volatile organic compounds: modeling and further analysis of the RIOPA data.个人对挥发性有机化合物混合物的暴露:RIOPA数据的建模与进一步分析
Res Rep Health Eff Inst. 2014 Jun(181):3-63.
4
[Characteristics, Ozone Formation Potential, and Source Apportionment of VOCs During the COVID-19 Epidemic in Xiong'an].[雄安新区新冠肺炎疫情期间挥发性有机物的特征、臭氧生成潜势及来源解析]
Huan Jing Ke Xue. 2022 Mar 8;43(3):1268-1276. doi: 10.13227/j.hjkx.202106253.
5
Pollution characteristics, source appointment and environmental effect of oxygenated volatile organic compounds in Guangdong-Hong Kong-Macao Greater Bay Area: Implication for air quality management.粤港澳大湾区含氧挥发性有机化合物的污染特征、来源解析及环境效应:对空气质量管理的启示。
Sci Total Environ. 2024 Apr 1;919:170836. doi: 10.1016/j.scitotenv.2024.170836. Epub 2024 Feb 10.
6
[Source Apportionment of Ambient VOCs in Qingdao Based on Photochemical Loss Correction].基于光化学损失校正的青岛市环境挥发性有机物源解析
Huan Jing Ke Xue. 2023 Dec 8;44(12):6551-6563. doi: 10.13227/j.hjkx.202212008.
7
A quantitative assessment of source contributions to fine particulate matter (PM)-bound polycyclic aromatic hydrocarbons (PAHs) and their nitrated and hydroxylated derivatives in Hong Kong.香港细颗粒物(PM)结合的多环芳烃(PAHs)及其硝化和羟基化衍生物的源贡献定量评估。
Environ Pollut. 2016 Dec;219:742-749. doi: 10.1016/j.envpol.2016.07.034. Epub 2016 Jul 22.
8
Potential air toxics hot spots in truck terminals and cabs.卡车终点站和驾驶室中潜在的空气有毒物质热点地区。
Res Rep Health Eff Inst. 2012 Dec(172):5-82.
9
Evaluation of the effectiveness of air pollution control measures in Hong Kong.评估香港空气污染控制措施的有效性。
Environ Pollut. 2017 Jan;220(Pt A):87-94. doi: 10.1016/j.envpol.2016.09.025. Epub 2016 Sep 12.
10
Optimization of a volatile organic compound control strategy in an oil industry center in Canada by evaluating ozone and secondary organic aerosol formation potential.通过评估臭氧和二次有机气溶胶形成潜力优化加拿大石油行业中心的挥发性有机化合物控制策略。
Environ Res. 2020 Dec;191:110217. doi: 10.1016/j.envres.2020.110217. Epub 2020 Sep 22.

本文引用的文献

1
Volatile organic compounds at a roadside site in Hong Kong: Characteristics, chemical reactivity, and health risk assessment.香港路边站点的挥发性有机化合物:特征、化学反应性及健康风险评估。
Sci Total Environ. 2023 Mar 25;866:161370. doi: 10.1016/j.scitotenv.2022.161370. Epub 2023 Jan 6.
2
Health Risk-Oriented Source Apportionment of Hazardous Volatile Organic Compounds in Eight Canadian Cities and Implications for Prioritizing Mitigation Strategies.
Environ Sci Technol. 2022 Sep 6;56(17):12077-12085. doi: 10.1021/acs.est.2c02558. Epub 2022 Aug 8.
3
Emission trends of industrial VOCs in China since the clean air action and future reduction perspectives.自清洁空气行动以来中国工业挥发性有机化合物的排放趋势及未来减排前景
Sci Total Environ. 2022 Jun 20;826:153994. doi: 10.1016/j.scitotenv.2022.153994. Epub 2022 Feb 25.
4
An Examination of National Cancer Risk Based on Monitored Hazardous Air Pollutants.基于监测到的有害空气污染物对国家癌症风险的考察。
Environ Health Perspect. 2021 Mar;129(3):37008. doi: 10.1289/EHP8044. Epub 2021 Mar 24.
5
An updated model-ready emission inventory for Guangdong Province by incorporating big data and mapping onto multiple chemical mechanisms.利用大数据并将其映射到多种化学机制,为广东省建立了一个更新的、适用于模型的排放清单。
Sci Total Environ. 2021 May 15;769:144535. doi: 10.1016/j.scitotenv.2020.144535. Epub 2021 Jan 7.
6
Hazardous volatile organic compounds in ambient air of China.中国环境空气中的有害挥发性有机化合物。
Chemosphere. 2020 May;246:125731. doi: 10.1016/j.chemosphere.2019.125731. Epub 2019 Dec 27.
7
Reconciling discrepancies in the source characterization of VOCs between emission inventories and receptor modeling.协调排放清单和受体模型中 VOC 源特征描述之间的差异。
Sci Total Environ. 2018 Jul 1;628-629:697-706. doi: 10.1016/j.scitotenv.2018.02.102. Epub 2018 Feb 20.
8
Species-specified VOC emissions derived from a gridded study in the Pearl River Delta, China.源自中国珠江三角洲网格化研究的特定物种挥发性有机化合物排放。
Sci Rep. 2018 Feb 14;8(1):2963. doi: 10.1038/s41598-018-21296-y.
9
Ambient and Emission Trends of Toxic Air Contaminants in California.加利福尼亚有毒空气污染物的环境与排放趋势。
Environ Sci Technol. 2015 Oct 6;49(19):11329-39. doi: 10.1021/acs.est.5b02766. Epub 2015 Sep 21.
10
Comparative assessment of air pollution-related health risks in Houston.休斯顿空气污染相关健康风险的比较评估。
Environ Health Perspect. 2007 Oct;115(10):1388-93. doi: 10.1289/ehp.10043.