Department of Pharmacy, The Affiliated Suzhou Hospital of Nanjing Medical University, Suzhou Municipal Hospital, Suzhou, China.
Gusu School, Nanjing Medical University, Suzhou, China.
Sci Rep. 2024 Oct 30;14(1):26064. doi: 10.1038/s41598-024-77768-x.
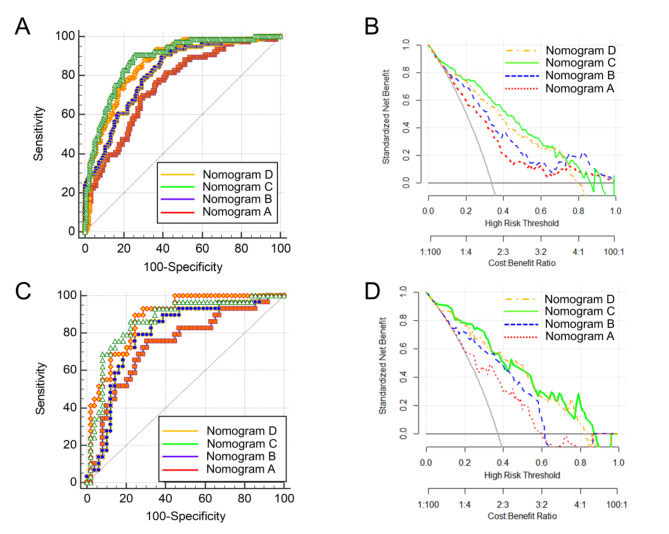
A nomogram to estimate the risk of linezolid-induced thrombocytopenia in patients with renal impairment is not available. The aim of the study is to develop a nomogram for predicting linezolid-induced thrombocytopenia in patients with renal impairment and to investigate the incremental value of PNU-142300 concentration beyond clinical factors and linezolid trough concentration (C) for risk prediction. Logistic regression was used to identify independent risk factors for linezolid-induced thrombocytopenia in patients with renal impairment and nomograms were established. The performance of the nomograms was assessed in terms of area under the receiver operating characteristic curve (AUROC), net reclassification improvement (NRI), integrated discrimination improvement (IDI) , decision curve analysis (DCA) and calibration. Internal validation and external validation of the nomograms were also performed. Four nomograms were created: nomogram A including total bilirubin, creatinine clearance and concomitant mannitol use; nomogram B containing linezolid C additionally; nomogram C containing total bilirubin, concomitant mannitol use, linezolid C, and PNU142300 concentration; nomogram D including total bilirubin, concomitant mannitol use, and PNU142300 concentration. Nomogram C improved the prediction performance than nomogram A (AUROC 0.881 vs. 0.749; NRI 0.290; IDI 0.226) and nomogram B (AUROC 0.881 vs. 0.812; NRI 0.152; IDI 0.130) in the training cohort. DCA analysis showed that nomogram C yielded a greater net benefit. Compared with nomogram A and nomogram B, nomogram C also showed superior discriminatory efficacy, good calibration and clinical usefulness in the external validation cohort. The nomogram containing PNU-142300 concentration and linezolid C had better predictive capability than that containing linezolid C for predicting linezolid-induced thrombocytopenia in patients with renal impairment.
尚无用于估算肾功能损害患者中利奈唑胺诱导血小板减少风险的列线图。本研究旨在建立预测肾功能损害患者中利奈唑胺诱导血小板减少的列线图,并探讨 PNU-142300 浓度除临床因素和利奈唑胺谷浓度(C)以外对风险预测的增量价值。使用逻辑回归来确定肾功能损害患者中利奈唑胺诱导血小板减少的独立危险因素,并建立列线图。通过接受者操作特征曲线(AUROC)下面积、净重新分类改善(NRI)、综合判别改善(IDI)、决策曲线分析(DCA)和校准来评估列线图的性能。还进行了列线图的内部验证和外部验证。建立了四个列线图:列线图 A 包括总胆红素、肌酐清除率和同时使用甘露醇;列线图 B 包含利奈唑胺 C;列线图 C 包含总胆红素、同时使用甘露醇、利奈唑胺 C 和 PNU142300 浓度;列线图 D 包含总胆红素、同时使用甘露醇和 PNU142300 浓度。在训练队列中,列线图 C 改善了预测性能,优于列线图 A(AUROC 0.881 与 0.749;NRI 0.290;IDI 0.226)和列线图 B(AUROC 0.881 与 0.812;NRI 0.152;IDI 0.130)。DCA 分析表明,列线图 C 产生了更大的净收益。与列线图 A 和列线图 B 相比,列线图 C 在外部验证队列中也表现出更好的判别效果、良好的校准和临床实用性。含有 PNU-142300 浓度和利奈唑胺 C 的列线图预测肾功能损害患者中利奈唑胺诱导血小板减少的能力优于仅含有利奈唑胺 C 的列线图。