• 文献检索
  • 文档翻译
  • 深度研究
  • 学术资讯
  • Suppr Zotero 插件Zotero 插件
  • 邀请有礼
  • 套餐&价格
  • 历史记录
应用&插件
Suppr Zotero 插件Zotero 插件浏览器插件Mac 客户端Windows 客户端微信小程序
定价
高级版会员购买积分包购买API积分包
服务
文献检索文档翻译深度研究API 文档MCP 服务
关于我们
关于 Suppr公司介绍联系我们用户协议隐私条款
关注我们

Suppr 超能文献

核心技术专利:CN118964589B侵权必究
粤ICP备2023148730 号-1Suppr @ 2026

文献检索

告别复杂PubMed语法,用中文像聊天一样搜索,搜遍4000万医学文献。AI智能推荐,让科研检索更轻松。

立即免费搜索

文件翻译

保留排版,准确专业,支持PDF/Word/PPT等文件格式,支持 12+语言互译。

免费翻译文档

深度研究

AI帮你快速写综述,25分钟生成高质量综述,智能提取关键信息,辅助科研写作。

立即免费体验

地球的气候历史解释了生命的最佳温度。

Earth's Climate History Explains Life's Temperature Optima.

作者信息

Schipper Louis A, Reeve Jennifer L, Arcus Vickery L, Isson Terry, Prentice Erica J, Williamson Adele, Barnes Andrew D

机构信息

Te Aka Mātuatua School of Science The University of Waikato Hamilton Aotearoa New Zealand.

Te Aka Mātuatua School of Science The University of Waikato Tauranga Aotearoa New Zealand.

出版信息

Ecol Evol. 2024 Dec 12;14(12):e70701. doi: 10.1002/ece3.70701. eCollection 2024 Dec.

DOI:10.1002/ece3.70701
PMID:39669503
原文链接:https://pmc.ncbi.nlm.nih.gov/articles/PMC11635308/
Abstract

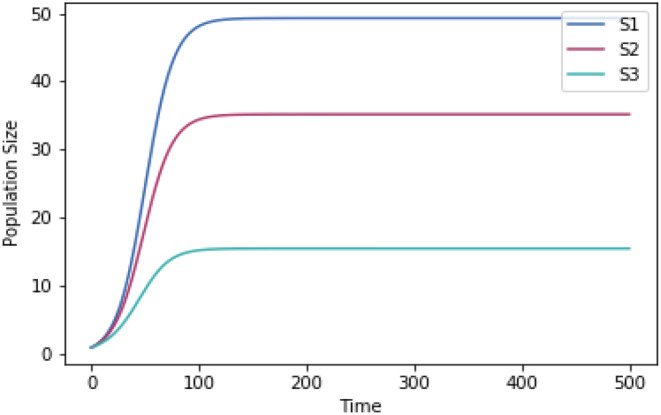
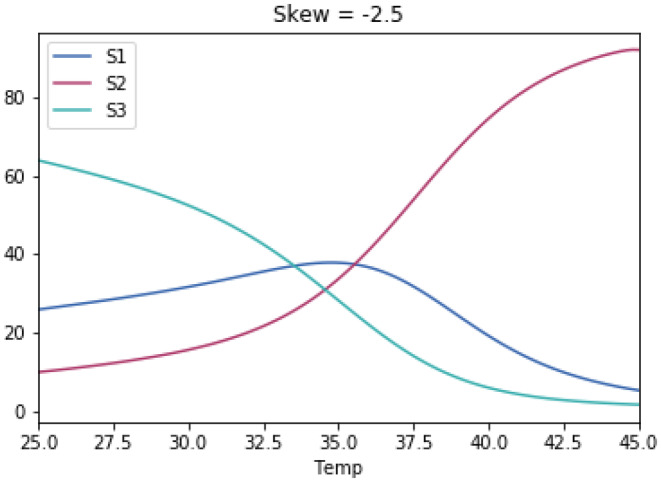
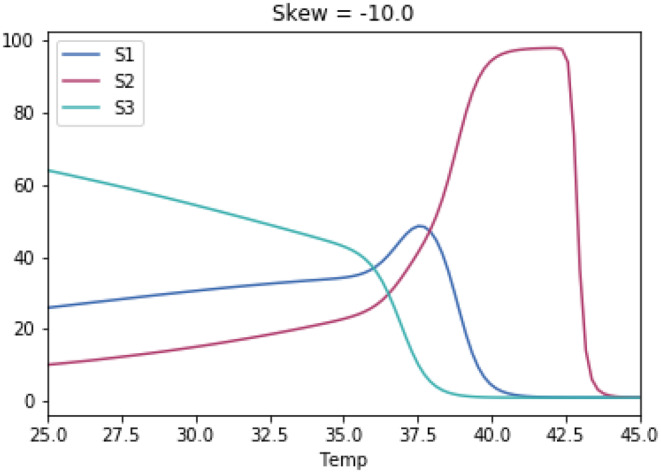
Why does the growth of most life forms exhibit a narrow range of optimal temperatures below 40°C? We hypothesize that the recently identified stable range of oceanic temperatures of ~5 to 37°C for more than two billion years of Earth history tightly constrained the evolution of prokaryotic thermal performance curves to optimal temperatures for growth to less than 40°C. We tested whether competitive mechanisms reproduced the observed upper limits of life's temperature optima using simple Lotka-Volterra models of interspecific competition between organisms with different temperature optima. Model results supported our proposition whereby organisms with temperature optima up to 37°C were most competitive. Model results were highly robust to a wide range of reasonable variations in temperature response curves of modeled species. We further propose that inheritance of prokaryotic genes and subsequent co-evolution with microbial partners may have resulted in eukaryotes also fixing their temperature optima within this narrow temperature range. We hope this hypothesis will motivate considerable discussion and future work to advance our understanding of the remarkable consistency of the temperature dependence of life.

摘要

为什么大多数生命形式的生长在低于40°C的狭窄最佳温度范围内表现出来?我们推测,在地球历史超过20亿年的时间里,最近确定的约5至37°C的海洋温度稳定范围,将原核生物热性能曲线的进化紧紧限制在生长的最佳温度低于40°C。我们使用具有不同最佳温度的生物体之间种间竞争的简单洛特卡-沃尔泰拉模型,测试了竞争机制是否重现了观察到的生命最佳温度上限。模型结果支持了我们的观点,即最佳温度高达37°C的生物体最具竞争力。模型结果对建模物种温度响应曲线的广泛合理变化具有高度鲁棒性。我们进一步提出,原核基因的遗传以及随后与微生物伙伴的共同进化,可能导致真核生物也将其最佳温度固定在这个狭窄的温度范围内。我们希望这个假设能引发大量讨论和未来的工作,以推进我们对生命温度依赖性显著一致性的理解。

https://cdn.ncbi.nlm.nih.gov/pmc/blobs/b241/11635308/fe699bcd1fe2/ECE3-14-e70701-g003.jpg
https://cdn.ncbi.nlm.nih.gov/pmc/blobs/b241/11635308/cf76845296d6/ECE3-14-e70701-g011.jpg
https://cdn.ncbi.nlm.nih.gov/pmc/blobs/b241/11635308/5ff2a68a6ee0/ECE3-14-e70701-g017.jpg
https://cdn.ncbi.nlm.nih.gov/pmc/blobs/b241/11635308/ba97e2f739c0/ECE3-14-e70701-g015.jpg
https://cdn.ncbi.nlm.nih.gov/pmc/blobs/b241/11635308/ee5e8f0a7ef0/ECE3-14-e70701-g005.jpg
https://cdn.ncbi.nlm.nih.gov/pmc/blobs/b241/11635308/01bd9ebe5415/ECE3-14-e70701-g027.jpg
https://cdn.ncbi.nlm.nih.gov/pmc/blobs/b241/11635308/b5409b08f6cb/ECE3-14-e70701-g020.jpg
https://cdn.ncbi.nlm.nih.gov/pmc/blobs/b241/11635308/fb4c5e5bcaff/ECE3-14-e70701-g024.jpg
https://cdn.ncbi.nlm.nih.gov/pmc/blobs/b241/11635308/39423d908b1b/ECE3-14-e70701-g012.jpg
https://cdn.ncbi.nlm.nih.gov/pmc/blobs/b241/11635308/01250c5e997c/ECE3-14-e70701-g007.jpg
https://cdn.ncbi.nlm.nih.gov/pmc/blobs/b241/11635308/ebe82906e80a/ECE3-14-e70701-g026.jpg
https://cdn.ncbi.nlm.nih.gov/pmc/blobs/b241/11635308/5cb4ee8d25da/ECE3-14-e70701-g004.jpg
https://cdn.ncbi.nlm.nih.gov/pmc/blobs/b241/11635308/2ae13497d76f/ECE3-14-e70701-g025.jpg
https://cdn.ncbi.nlm.nih.gov/pmc/blobs/b241/11635308/9987d0230ecb/ECE3-14-e70701-g021.jpg
https://cdn.ncbi.nlm.nih.gov/pmc/blobs/b241/11635308/b5592c2c0cbf/ECE3-14-e70701-g009.jpg
https://cdn.ncbi.nlm.nih.gov/pmc/blobs/b241/11635308/373d2d95a638/ECE3-14-e70701-g008.jpg
https://cdn.ncbi.nlm.nih.gov/pmc/blobs/b241/11635308/ad352b23321b/ECE3-14-e70701-g016.jpg
https://cdn.ncbi.nlm.nih.gov/pmc/blobs/b241/11635308/fdc04de61bce/ECE3-14-e70701-g018.jpg
https://cdn.ncbi.nlm.nih.gov/pmc/blobs/b241/11635308/93a0bbedd504/ECE3-14-e70701-g002.jpg
https://cdn.ncbi.nlm.nih.gov/pmc/blobs/b241/11635308/320bf1ebe41d/ECE3-14-e70701-g001.jpg
https://cdn.ncbi.nlm.nih.gov/pmc/blobs/b241/11635308/fd9fc01b4f35/ECE3-14-e70701-g014.jpg
https://cdn.ncbi.nlm.nih.gov/pmc/blobs/b241/11635308/ba5994391a4e/ECE3-14-e70701-g019.jpg
https://cdn.ncbi.nlm.nih.gov/pmc/blobs/b241/11635308/e0434fd1ec83/ECE3-14-e70701-g013.jpg
https://cdn.ncbi.nlm.nih.gov/pmc/blobs/b241/11635308/4373bd738995/ECE3-14-e70701-g006.jpg
https://cdn.ncbi.nlm.nih.gov/pmc/blobs/b241/11635308/15ae41e8ec09/ECE3-14-e70701-g023.jpg
https://cdn.ncbi.nlm.nih.gov/pmc/blobs/b241/11635308/9f1c14bdb598/ECE3-14-e70701-g022.jpg
https://cdn.ncbi.nlm.nih.gov/pmc/blobs/b241/11635308/9aa0dd8467b2/ECE3-14-e70701-g028.jpg
https://cdn.ncbi.nlm.nih.gov/pmc/blobs/b241/11635308/fe699bcd1fe2/ECE3-14-e70701-g003.jpg

相似文献

1
Earth's Climate History Explains Life's Temperature Optima.地球的气候历史解释了生命的最佳温度。
Ecol Evol. 2024 Dec 12;14(12):e70701. doi: 10.1002/ece3.70701. eCollection 2024 Dec.
2
Optimum Temperatures for Net Primary Productivity of Three Tropical Seagrass Species.三种热带海草物种净初级生产力的最佳温度
Front Plant Sci. 2017 Aug 23;8:1446. doi: 10.3389/fpls.2017.01446. eCollection 2017.
3
Mean mass-specific metabolic rates are strikingly similar across life's major domains: Evidence for life's metabolic optimum.跨生命主要领域的平均质量比代谢率惊人地相似:生命代谢最优的证据。
Proc Natl Acad Sci U S A. 2008 Nov 4;105(44):16994-9. doi: 10.1073/pnas.0802148105. Epub 2008 Oct 24.
4
Did surface temperatures constrain microbial evolution?地表温度是否限制了微生物的进化?
Bioscience. 1993 Jun;43(6):390-3.
5
Antagonistic effects of intraspecific cooperation and interspecific competition on thermal performance.种内合作和种间竞争对热性能的拮抗作用。
Elife. 2020 Aug 18;9:e57022. doi: 10.7554/eLife.57022.
6
A common thermal niche among geographically diverse populations of the widely distributed tree species Eucalyptus tereticornis: No evidence for adaptation to climate-of-origin.广泛分布的树种桉树在地理上不同种群之间存在共同的热生态位:没有证据表明对起源地气候的适应。
Glob Chang Biol. 2017 Dec;23(12):5069-5082. doi: 10.1111/gcb.13771. Epub 2017 Jul 8.
7
Highly conserved thermal performance strategies may limit adaptive potential in corals.高度保守的热性能策略可能限制珊瑚的适应潜力。
Proc Biol Sci. 2023 Jan 11;290(1990):20221703. doi: 10.1098/rspb.2022.1703.
8
Energy conservation in the earth's crust and climate change.地壳能量守恒与气候变化。
J Air Waste Manag Assoc. 2013 Feb;63(2):150-60. doi: 10.1080/10962247.2012.739501.
9
Improved thermal preferences and a stressor index derived from modeled stream temperatures and regional taxonomic standards for freshwater macroinvertebrates of the Pacific Northwest, USA.根据美国太平洋西北地区淡水大型无脊椎动物的模拟溪流温度和区域分类标准得出的改善的热偏好和应激源指数。
Ecol Indic. 2024 Mar 11;160:111869. doi: 10.1016/j.ecolind.2024.111869.
10
Combined effects of temperature and macronutrient balance on life-history traits in Drosophila melanogaster: implications for life-history trade-offs and fundamental niche.温度和宏量营养素平衡对黑腹果蝇生活史特征的综合影响:对生活史权衡和基础生态位的启示。
Oecologia. 2020 Jun;193(2):299-309. doi: 10.1007/s00442-020-04666-0. Epub 2020 May 16.

本文引用的文献

1
Oxygen isotope ensemble reveals Earth's seawater, temperature, and carbon cycle history.氧同位素组合揭示了地球海水、温度和碳循环历史。
Science. 2024 Feb 9;383(6683):666-670. doi: 10.1126/science.adg1366. Epub 2024 Feb 8.
2
A general theory for temperature dependence in biology.一种关于生物学中温度依赖性的一般理论。
Proc Natl Acad Sci U S A. 2022 Jul 26;119(30):e2119872119. doi: 10.1073/pnas.2119872119. Epub 2022 Jul 18.
3
Systematic investigation of the link between enzyme catalysis and cold adaptation.系统研究酶催化与冷适应之间的联系。
Elife. 2022 Jan 12;11:e72884. doi: 10.7554/eLife.72884.
4
Temperature-Dependent Competitive Outcomes between the Fruit Flies and .温度对果蝇和 之间竞争结果的影响
Am Nat. 2021 Mar;197(3):312-323. doi: 10.1086/712781. Epub 2021 Jan 15.
5
The evolution of critical thermal limits of life on Earth.地球上生命的临界热极限的演变。
Nat Commun. 2021 Feb 19;12(1):1198. doi: 10.1038/s41467-021-21263-8.
6
Evolution and plasticity of thermal performance: an analysis of variation in thermal tolerance and fitness in 22 Drosophila species.热性能的进化和可塑性:对 22 种果蝇物种热耐受和适应性变异性的分析。
Philos Trans R Soc Lond B Biol Sci. 2019 Aug 5;374(1778):20180548. doi: 10.1098/rstb.2018.0548. Epub 2019 Jun 17.
7
Correlating enzyme annotations with a large set of microbial growth temperatures reveals metabolic adaptations to growth at diverse temperatures.将酶注释与大量微生物生长温度相关联,揭示了微生物对不同温度下生长的代谢适应。
BMC Microbiol. 2018 Nov 6;18(1):177. doi: 10.1186/s12866-018-1320-7.
8
A widespread thermodynamic effect, but maintenance of biological rates through space across life's major domains.一种普遍的热力学效应,但通过生命的主要领域在空间上维持生物速率。
Proc Biol Sci. 2018 Oct 31;285(1890):20181775. doi: 10.1098/rspb.2018.1775.
9
Eocene greenhouse climate revealed by coupled clumped isotope-Mg/Ca thermometry.耦合同位素聚类-镁/钙测温揭示始新世温室气候。
Proc Natl Acad Sci U S A. 2018 Feb 6;115(6):1174-1179. doi: 10.1073/pnas.1714744115. Epub 2018 Jan 22.
10
History of the ribosome and the origin of translation.核糖体的历史与翻译的起源。
Proc Natl Acad Sci U S A. 2015 Dec 15;112(50):15396-401. doi: 10.1073/pnas.1509761112. Epub 2015 Nov 30.