Han Kyunghoon, Boziki Ariadni, Tkatchenko Alexandre, Berryman Joshua T
Department of Physics and Materials Science, University of Luxembourg, L-1511 Luxembourg City, Luxembourg.
ACS Omega. 2024 Dec 6;9(50):49397-49410. doi: 10.1021/acsomega.4c06830. eCollection 2024 Dec 17.
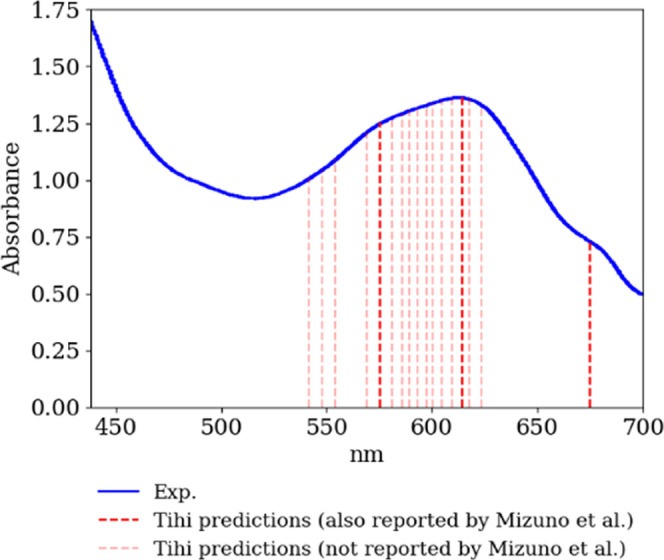
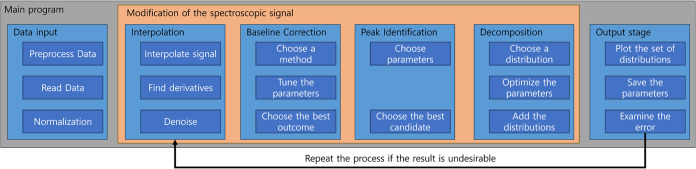
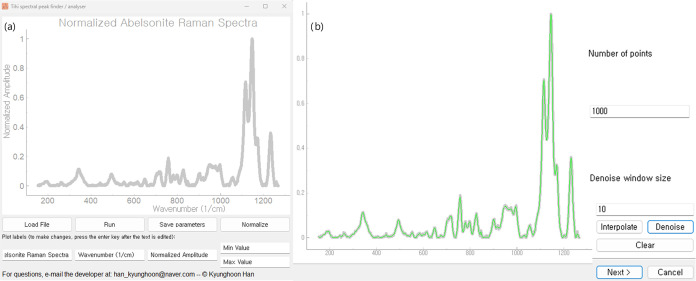
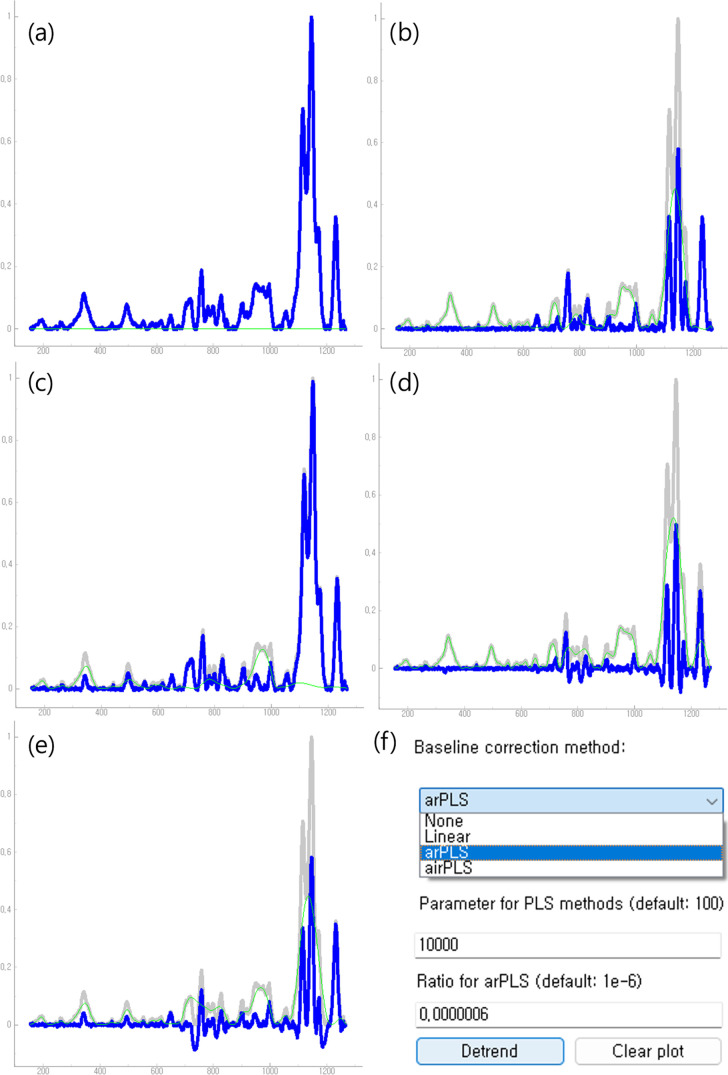
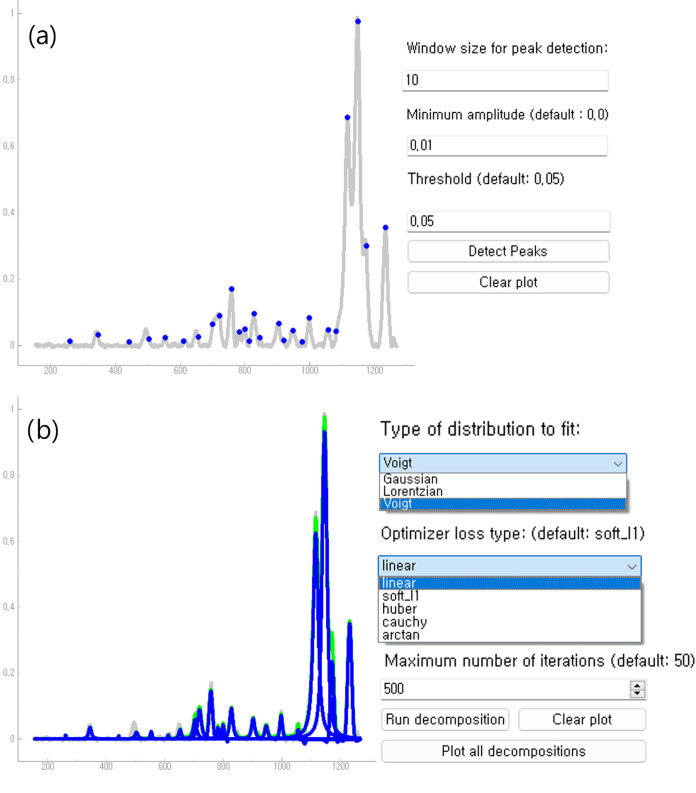
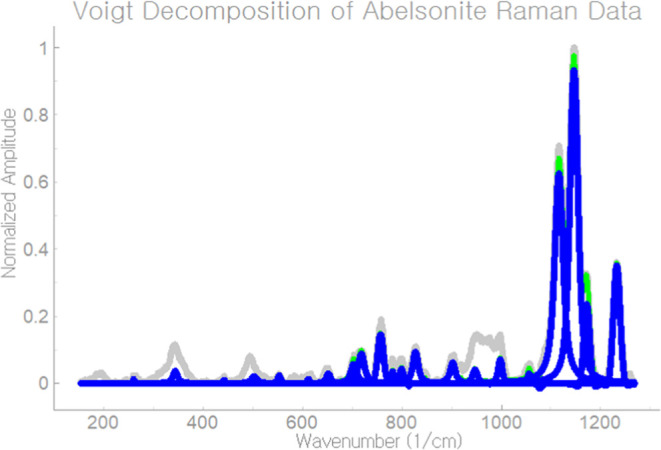
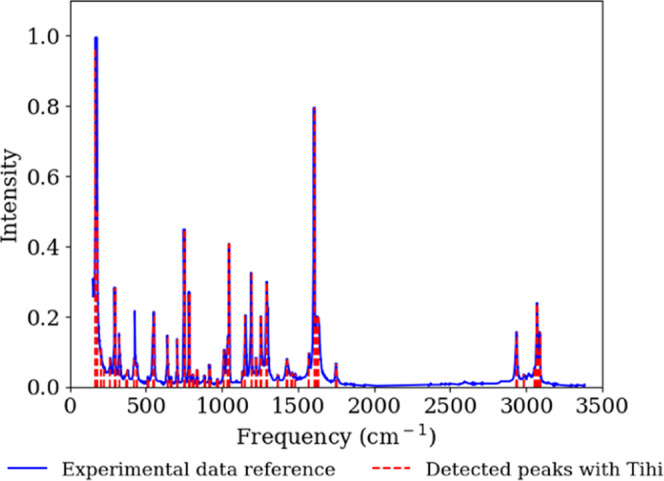
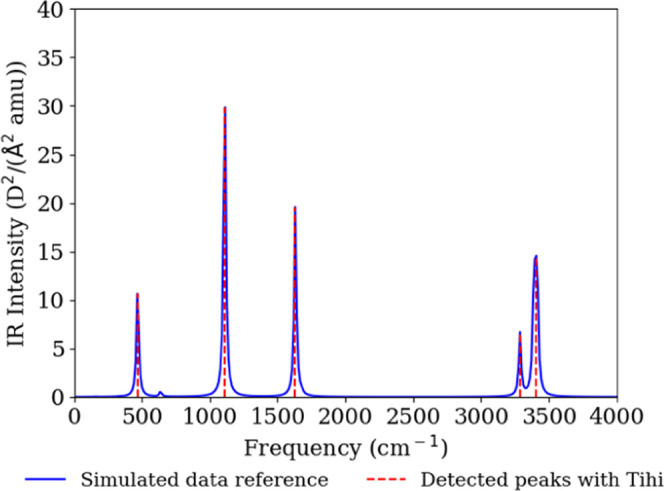
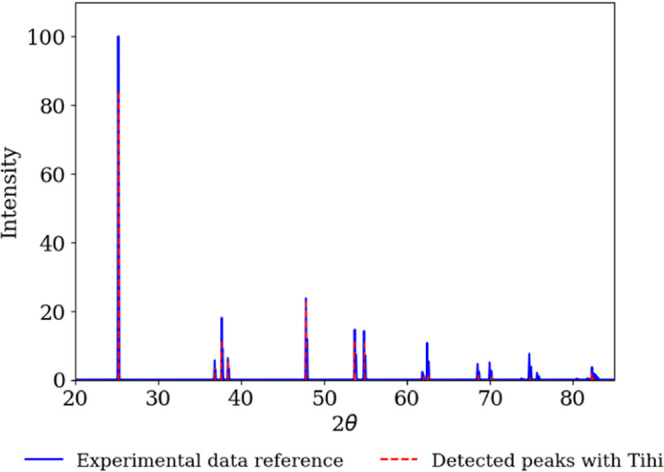
Complex signal vectors, particularly spectra, are integral to many scientific domains. Interpreting these signals often involves decomposing them into contributions from independent components and subtraction or deconvolution of the channel and instrument noise. Despite the fundamental nature of this task, researchers frequently rely on costly commercial tools. To make such tools accessible to all, we present , interactive, open-source multiplatform software for interpolation, denoising, baseline correction, peak detection, and signal decomposition. provides a user-friendly graphical interface (GUI) that facilitates the analysis of spectroscopic data and more. It allows researchers to contribute to and freely distribute these tools, ensuring broad accessibility and fostering collaborative improvements. We present examples demonstrating the efficiency of the program using the spectra of different systems acquired by different spectroscopic techniques, including Raman (aspirin), IR (solid ammonia), XRD (anatase), and UV-vis (petal tip from the flower). These examples showcase a variety of spectra that differ significantly, from signals with narrow profiles to signals with very broad profiles. This demonstrates the versatility of for peak identification in a wide range of spectroscopic techniques.
复杂信号向量,尤其是光谱,在许多科学领域中不可或缺。解释这些信号通常涉及将它们分解为独立成分的贡献,并减去或反卷积通道和仪器噪声。尽管这项任务具有基础性,但研究人员经常依赖昂贵的商业工具。为了让所有人都能使用此类工具,我们展示了一款用于插值、去噪、基线校正、峰值检测和信号分解的交互式、开源多平台软件。它提供了一个用户友好的图形界面(GUI),便于对光谱数据等进行分析。它允许研究人员贡献并自由分发这些工具,确保广泛的可及性并促进协作改进。我们展示了一些示例,这些示例使用不同光谱技术获取的不同系统的光谱来证明该程序的效率,这些光谱技术包括拉曼光谱(阿司匹林)、红外光谱(固态氨)、X射线衍射光谱(锐钛矿)和紫外可见光谱(某花的花瓣尖端)。这些示例展示了各种差异显著的光谱,从轮廓狭窄的信号到轮廓非常宽的信号。这证明了该软件在广泛的光谱技术中进行峰值识别的通用性。