Suppr超能文献

鸟类视顶盖激活过程中的场电位分布图。

The field potential profile during activation of the avian optic tectum.

作者信息

Holden A L

出版信息

J Physiol. 1968 Jan;194(1):75-90. doi: 10.1113/jphysiol.1968.sp008395.

Abstract
  1. The field potential profile resulting from electrical stimulation of the optic nerve-head was recorded with micro-electrodes inserted radially into the pigeon optic tectum.2. The first response, in the superficial tectum, was a graded negative wave, the N-wave. Its latency was 2.3 msec, S.D. 0.22 msec. The wave form underwent an abrupt polarity reversal in the R-zone, to yield a graded positive wave, the P-wave, in deeper laminae. The P-wave had a latency of 2.0 msec, S.D. 0.16 msec.3. Both N-wave and P-wave showed a graded increase in amplitude as stimulating current was increased. On any given track this increase occurred over a similar range of stimulating current.4. In many tracks the rise-time and duration of the N-wave were independent of amplitude.5. The rise-time of the P-wave was longer, and its duration was shorter, than the rise-time and duration of the N-wave. This effect was shown to be due to two successive sinks occurring superficially to the P-zone.6. Depth profiles also showed these two sinks, separately located in the N-zone and R-zone.7. To paired stimuli the N-wave showed refractoriness at intervals of 2-4.5 msec, facilitation at intervals up to 25 msec, and subsequent depression. It showed low-frequency depression at 10 and 20/sec.8. The R-zone was localized by a lesion technique to sub-layers d to g of the stratum griseum et fibrosum superficiale. Thus the tissue negativity was closely co-extensive with the anatomical distribution of optic nerve terminals.9. It is suggested that the N-wave is the sink of excitatory synaptic potentials produced in the superficial tectum, and predictions relating unitary firing to the field potential profile are made.
摘要
  1. 将微电极径向插入鸽视顶盖,记录视神经乳头电刺激产生的场电位分布。

  2. 在顶盖浅层的第一个反应是一个分级负波,即N波。其潜伏期为2.3毫秒,标准差为0.22毫秒。波形在R区发生突然的极性反转,在更深层产生一个分级正波,即P波。P波的潜伏期为2.0毫秒,标准差为0.16毫秒。

  3. N波和P波的振幅均随刺激电流的增加而分级增加。在任何给定的轨迹上,这种增加发生在相似的刺激电流范围内。

  4. 在许多轨迹中,N波的上升时间和持续时间与振幅无关。

  5. P波的上升时间比N波长,持续时间比N波短。这种效应被证明是由于在P区表面相继出现的两个电汇所致。

  6. 深度剖面图也显示了这两个电汇,分别位于N区和R区。

  7. 对于成对刺激,N波在2 - 4.5毫秒的间隔内表现出不应期,在长达25毫秒的间隔内表现出易化作用,随后出现抑制。它在10和20/秒时表现出低频抑制。

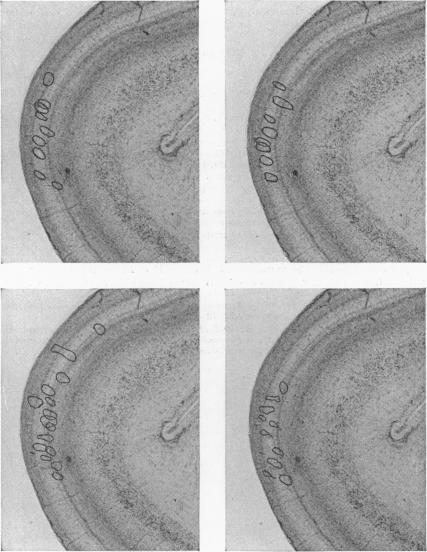
  8. 通过损伤技术将R区定位到浅灰质和纤维层的d至g亚层。因此,组织负性与视神经终末的解剖分布密切相关。

  9. 有人认为N波是顶盖浅层产生的兴奋性突触电位的电汇,并对与场电位分布相关的单位发放进行了预测。

https://cdn.ncbi.nlm.nih.gov/pmc/blobs/36ca/1365675/1434ab987a2a/jphysiol01108-0094-a.jpg

文献AI研究员

20分钟写一篇综述,助力文献阅读效率提升50倍。

立即体验

用中文搜PubMed

大模型驱动的PubMed中文搜索引擎

马上搜索

文档翻译

学术文献翻译模型,支持多种主流文档格式。

立即体验