Kumar Vikash, Dhabalia Jayesh V, Nelivigi Girish G, Punia Mahendra S, Suryavanshi Manav
Department of Urology, KEM Hospital, Parel, Mumbai 400 012, India.
Indian J Urol. 2009 Oct-Dec;25(4):461-6. doi: 10.4103/0970-1591.57912.
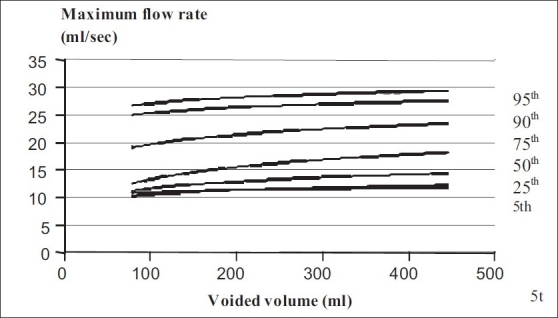
Objectives : The objective of this study was measurement of urine flow parameters by a non invasive urodynamic test. Variation of flow rates based on voided volume, age, and gender are described. Different nomograms are available for different populations and racial differences of urethral physiology are described. Currently, there has been no study from the Indian population on uroflow parameters. So the purpose of this study was to establish normal reference ranges of maximum and average flow rates, to see the influence of age, gender, and voided volume on flow rates, and to chart these values in the form of a nomogram. Methods : We evaluated 1,011 uroflowmetry tests in different age groups in a healthy population (healthy relatives of our patients) 16-50 year old males,> 50 year old males, 5-15 year old children, and> 15 year pre-menopausal and post-menopausal females. The uroflowmetry was done using the gravitimetric method. Flow chart parameters were analyzed and statistical calculations were used for drawing uroflow nomograms. Results : Qmax values in adult males were significantly higher than in the elderly and Qmax values in young females were significantly higher than in young males. Qmax values in males increased with age until 15 years old; followed by a slow decline until reaching 50 years old followed by a rapid decline after 50 years old even after correcting voided volume. Qmax values in females increased with age until they reached age 15 followed by decline in flow rate until a pre-menopausal age followed by no significant decline in post-menopausal females. Qmax values increased with voided volume until 700 cc followed by a plateau and decline. Conclusions : Qmax values more significantly correlated with age and voided volume than Qavg. Nomograms were drawn in centile form to provide normal reference ranges. Qmax values in our population were lower than described in literature. Patients with voided volume up to 50 ml could be evaluated with a nomogram.
本研究的目的是通过无创尿动力学测试测量尿流参数。描述了基于排尿量、年龄和性别的流速变化。针对不同人群有不同的列线图,并且描述了尿道生理的种族差异。目前,印度人群尚未有关于尿流参数的研究。因此,本研究的目的是建立最大和平均流速的正常参考范围,观察年龄、性别和排尿量对流速的影响,并以列线图的形式绘制这些值。
我们评估了健康人群(我们患者的健康亲属)中不同年龄组的1011次尿流率测定测试,包括16 - 50岁男性、>50岁男性、5 - 15岁儿童以及>15岁的绝经前和绝经后女性。使用重量法进行尿流率测定。分析流程图参数并进行统计计算以绘制尿流列线图。
成年男性的Qmax值显著高于老年人,年轻女性的Qmax值显著高于年轻男性。男性的Qmax值在15岁之前随年龄增加;随后缓慢下降直至50岁,50岁之后即使校正排尿量后仍快速下降。女性的Qmax值在15岁之前随年龄增加,随后流速下降直至绝经前年龄,绝经后女性则无显著下降。Qmax值随排尿量增加直至700 cc,随后趋于平稳并下降。
Qmax值比Qavg与年龄和排尿量的相关性更显著。以百分位数形式绘制列线图以提供正常参考范围。我们人群中的Qmax值低于文献中描述的值。排尿量达50 ml的患者可用列线图进行评估。