• 文献检索
  • 文档翻译
  • 深度研究
  • 学术资讯
  • Suppr Zotero 插件Zotero 插件
  • 邀请有礼
  • 套餐&价格
  • 历史记录
应用&插件
Suppr Zotero 插件Zotero 插件浏览器插件Mac 客户端Windows 客户端微信小程序
定价
高级版会员购买积分包购买API积分包
服务
文献检索文档翻译深度研究API 文档MCP 服务
关于我们
关于 Suppr公司介绍联系我们用户协议隐私条款
关注我们

Suppr 超能文献

核心技术专利:CN118964589B侵权必究
粤ICP备2023148730 号-1Suppr @ 2026

文献检索

告别复杂PubMed语法,用中文像聊天一样搜索,搜遍4000万医学文献。AI智能推荐,让科研检索更轻松。

立即免费搜索

文件翻译

保留排版,准确专业,支持PDF/Word/PPT等文件格式,支持 12+语言互译。

免费翻译文档

深度研究

AI帮你快速写综述,25分钟生成高质量综述,智能提取关键信息,辅助科研写作。

立即免费体验

结合可用性技术设计用于流行病学的地理可视化工具。

Combining Usability Techniques to Design Geovisualization Tools for Epidemiology.

作者信息

Robinson Anthony C, Chen Jin, Lengerich Eugene J, Meyer Hans G, Maceachren Alan M

机构信息

GeoVISTA Center, Department of Geography, 302 Walker Building, The Pennsylvania State University University Park, PA 16802, USA. Tel: (814-865-3433);

出版信息

Cartogr Geogr Inf Sci. 2005 Oct 1;32(4):243-255. doi: 10.1559/152304005775194700.

DOI:10.1559/152304005775194700
PMID:19960106
原文链接:https://pmc.ncbi.nlm.nih.gov/articles/PMC2786201/
Abstract

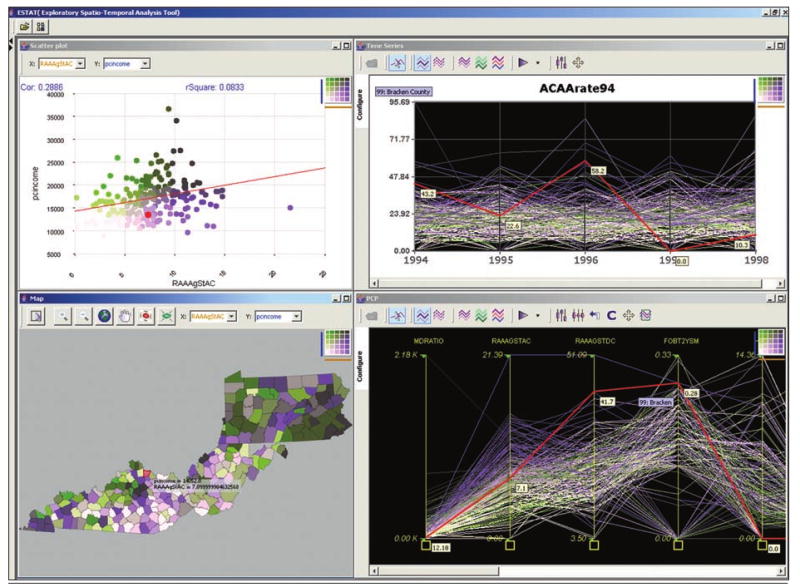
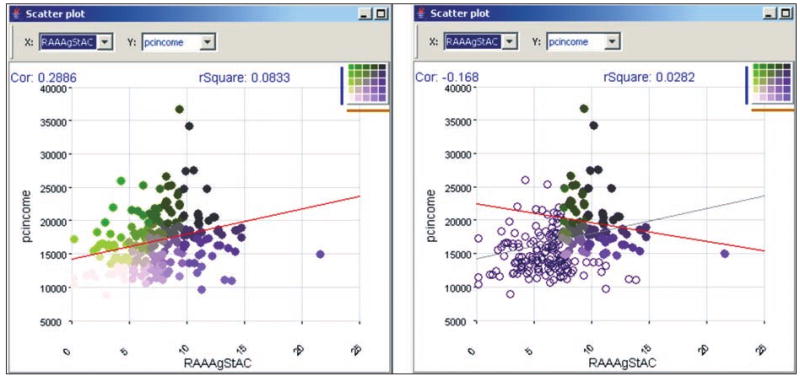
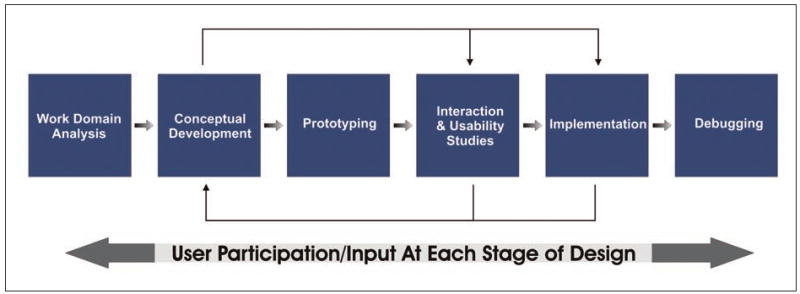
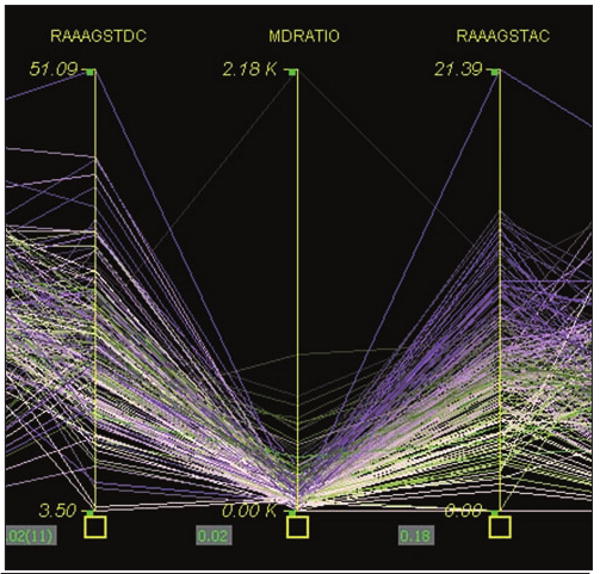
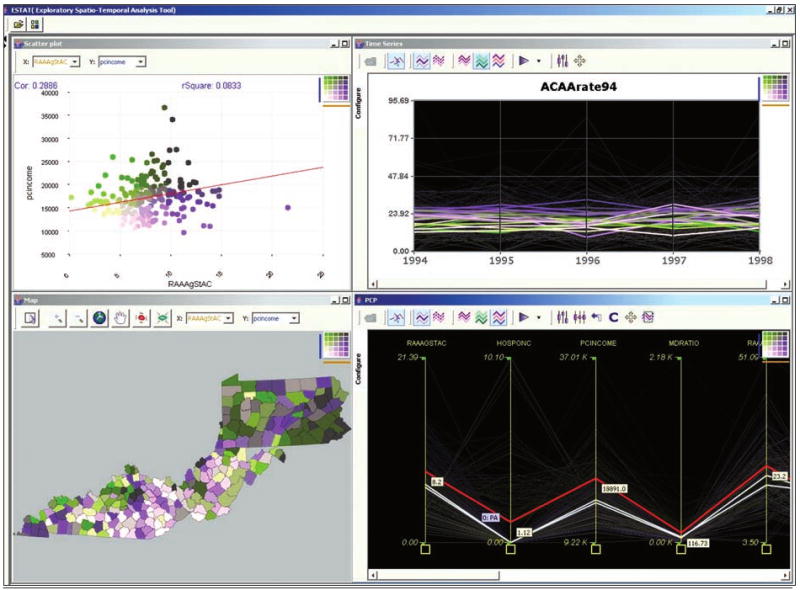
Designing usable geovisualization tools is an emerging problem in GIScience software development. We are often satisfied that a new method provides an innovative window on our data, but functionality alone is insufficient assurance that a tool is applicable to a problem in situ. As extensions of the static methods they evolved from, geovisualization tools are bound to enable new knowledge creation. We have yet to learn how to adapt techniques from interaction designers and usability experts toward our tools in order to maximize this ability. This is especially challenging because there is limited existing guidance for the design of usable geovisualization tools. Their design requires knowledge about the context of work within which they will be used, and should involve user input at all stages, as is the practice in any human-centered design effort. Toward that goal, we have employed a wide range of techniques in the design of ESTAT, an exploratory geovisualization toolkit for epidemiology. These techniques include; verbal protocol analysis, card-sorting, focus groups, and an in-depth case study. This paper reports the design process and evaluation results from our experience with the ESTAT toolkit.

摘要

设计可用的地理可视化工具是地理信息科学软件开发中一个新出现的问题。我们常常满足于一种新方法为我们的数据提供了一个创新的窗口,但仅靠功能并不能充分保证一个工具适用于实际问题。作为从其演化而来的静态方法的扩展,地理可视化工具必然会促进新知识的创造。我们尚未学会如何将交互设计师和可用性专家的技术应用于我们的工具,以最大限度地发挥这种能力。这尤其具有挑战性,因为现有的关于可用地理可视化工具设计的指导有限。它们的设计需要了解其使用的工作背景知识,并且应该在所有阶段都有用户参与,这与任何以用户为中心的设计工作的做法相同。为了实现这一目标,我们在设计ESTAT(一种用于流行病学的探索性地理可视化工具包)时采用了多种技术。这些技术包括:口头协议分析、卡片分类、焦点小组以及深入的案例研究。本文报告了我们使用ESTAT工具包的设计过程和评估结果。

https://cdn.ncbi.nlm.nih.gov/pmc/blobs/7cd9/2786201/e3a46cb3b1aa/nihms68027f6.jpg
https://cdn.ncbi.nlm.nih.gov/pmc/blobs/7cd9/2786201/20f933b1592a/nihms68027f1.jpg
https://cdn.ncbi.nlm.nih.gov/pmc/blobs/7cd9/2786201/fe352b4c7082/nihms68027f2.jpg
https://cdn.ncbi.nlm.nih.gov/pmc/blobs/7cd9/2786201/e5c614b78a9a/nihms68027f3.jpg
https://cdn.ncbi.nlm.nih.gov/pmc/blobs/7cd9/2786201/d2ffa0087585/nihms68027f4.jpg
https://cdn.ncbi.nlm.nih.gov/pmc/blobs/7cd9/2786201/a48b888692ad/nihms68027f5.jpg
https://cdn.ncbi.nlm.nih.gov/pmc/blobs/7cd9/2786201/e3a46cb3b1aa/nihms68027f6.jpg

相似文献

1
Combining Usability Techniques to Design Geovisualization Tools for Epidemiology.结合可用性技术设计用于流行病学的地理可视化工具。
Cartogr Geogr Inf Sci. 2005 Oct 1;32(4):243-255. doi: 10.1559/152304005775194700.
2
A design framework for exploratory geovisualization in epidemiology.流行病学中探索性地理可视化的设计框架。
Inf Vis. 2007 Winter;6(3):197-214. doi: 10.1057/palgrave.ivs.9500155.
3
An empirically-derived taxonomy of interaction primitives for interactive cartography and geovisualization.用于交互制图学和地理可视化的交互原语的经验主义分类法。
IEEE Trans Vis Comput Graph. 2013 Dec;19(12):2356-65. doi: 10.1109/TVCG.2013.130.
4
Using co-design to develop a tool for shared goal-setting with parents in speech and language therapy.运用共同设计为言语语言治疗中与家长共同制定目标开发工具。
Int J Lang Commun Disord. 2022 Nov;57(6):1281-1303. doi: 10.1111/1460-6984.12753. Epub 2022 Jul 20.
5
Usability testing of Avoiding Diabetes Thru Action Plan Targeting (ADAPT) decision support for integrating care-based counseling of pre-diabetes in an electronic health record.通过行动计划目标预防糖尿病(ADAPT)决策支持系统在电子健康记录中整合基于护理的糖尿病前期咨询的可用性测试。
Int J Med Inform. 2014 Sep;83(9):636-47. doi: 10.1016/j.ijmedinf.2014.05.002. Epub 2014 May 23.
6
Creating a Digital Toolkit to Reduce Fatigue and Promote Quality of Life in Multiple Sclerosis: Participatory Design and Usability Study.创建一个数字工具包以减轻多发性硬化症患者的疲劳并提高其生活质量:参与式设计与可用性研究
JMIR Form Res. 2021 Dec 9;5(12):e19230. doi: 10.2196/19230.
7
Co-Designing the MOSAIC mHealth App With Breast Cancer Survivors: User-Centered Design Approach.与乳腺癌幸存者共同设计MOSAIC移动健康应用程序:以用户为中心的设计方法。
JMIR Form Res. 2024 Dec 9;8:e59426. doi: 10.2196/59426.
8
Designing eHealth Interventions for Pediatric Emergency Departments: Protocol for a Usability Testing Study With Youth, Parent, and Clinician Participants.为儿科急诊科设计电子健康干预措施:一项针对青少年、家长和临床医生参与者的可用性测试研究方案。
JMIR Res Protoc. 2025 Apr 14;14:e64350. doi: 10.2196/64350.
9
Incorporating user feedback in the design of a genetics analysis tool: A two-part approach.将用户反馈纳入遗传分析工具的设计中:两步走方法。
J Biomed Inform. 2019 Jul;95:103204. doi: 10.1016/j.jbi.2019.103204. Epub 2019 May 7.
10
A Digital Toolkit (M-Healer) to Improve Care and Reduce Human Rights Abuses Against People With Mental Illness in West Africa: User-Centered Design, Development, and Usability Study.一个旨在改善西非精神疾病患者护理并减少侵犯其人权行为的数字工具包(M-Healer):以用户为中心的设计、开发与可用性研究
JMIR Ment Health. 2021 Jul 2;8(7):e28526. doi: 10.2196/28526.

引用本文的文献

1
Introducing the combined atlas framework for large-scale web-based data visualization: The GloNAF atlas of plant invasion.介绍用于大规模基于网络的数据可视化的组合地图集框架:植物入侵的全球自然档案地图集。
Methods Ecol Evol. 2022 May;13(5):1073-1081. doi: 10.1111/2041-210X.13820. Epub 2022 Feb 22.
2
Pattern-Driven Navigation in 2D Multiscale Visualizations with Scalable Insets.基于可扩展缩略图的二维多尺度可视化中的模式驱动导航。
IEEE Trans Vis Comput Graph. 2020 Jan;26(1):611-621. doi: 10.1109/TVCG.2019.2934555. Epub 2019 Aug 22.
3
Visual Inquiry Toolkit - An Integrated Approach for Exploring and Interpreting Space-Time, Multivariate Patterns.

本文引用的文献

1
Patterns of colorectal cancer incidence, risk factors, and screening in Kentucky.肯塔基州结直肠癌的发病模式、风险因素及筛查情况
South Med J. 2004 Mar;97(3):216-23. doi: 10.1097/01.SMJ.0000116041.78617.92.
2
Users' perspectives on epidemiological, GIS and point pattern approaches to analysing environment and health data.用户对用于分析环境与健康数据的流行病学、地理信息系统及点模式方法的看法。
Health Place. 2004 Jun;10(2):169-82. doi: 10.1016/j.healthplace.2003.09.001.
3
Are there two sides to colorectal cancer?结直肠癌有两面性吗?
视觉探究工具包——探索和解释时空多元模式的综合方法。
Autocarto Res Symp. 2006 Jun;2006.
4
Visualization and analytics tools for infectious disease epidemiology: a systematic review.传染病流行病学的可视化与分析工具:一项系统综述
J Biomed Inform. 2014 Oct;51:287-98. doi: 10.1016/j.jbi.2014.04.006. Epub 2014 Apr 16.
5
Designing a web-based learning portal for geographic visualization and analysis in public health.设计一个基于网络的学习门户,用于公共卫生领域的地理可视化和分析。
Health Informatics J. 2011 Sep;17(3):191-208. doi: 10.1177/1460458211409718.
6
Resolution Control for Balancing Overview + Detail in Spatial, Multivariate Analysis.用于在空间多变量分析中平衡全局与细节的分辨率控制
Cartogr J. 2008 Nov 1;45(4):261-273. doi: 10.1179/174327708x347764.
7
The case for visual analytics of arsenic concentrations in foods.食品中砷浓度的可视化分析案例。
Int J Environ Res Public Health. 2010 May;7(5):1970-83. doi: 10.3390/ijerph7051970. Epub 2010 Apr 28.
8
A design framework for exploratory geovisualization in epidemiology.流行病学中探索性地理可视化的设计框架。
Inf Vis. 2007 Winter;6(3):197-214. doi: 10.1057/palgrave.ivs.9500155.
9
Supporting the Process of Exploring and Interpreting Space-Time Multivariate Patterns: The Visual Inquiry Toolkit.支持探索和解释时空多元模式的过程:视觉探究工具包。
Cartogr Geogr Inf Sci. 2008 Jan 1;35(1):33-50. doi: 10.1559/152304008783475689.
10
Distributed usability evaluation of the Pennsylvania Cancer Atlas.宾夕法尼亚癌症地图集的分布式可用性评估。
Int J Health Geogr. 2008 Jul 11;7:36. doi: 10.1186/1476-072X-7-36.
Int J Cancer. 2002 Oct 10;101(5):403-8. doi: 10.1002/ijc.10635.
4
Exploring spatial patterns of mortality: the new atlas of United States mortality.探索死亡率的空间模式:美国死亡率新地图集
Stat Med. 1999 Dec 15;18(23):3211-20. doi: 10.1002/(sici)1097-0258(19991215)18:23<3211::aid-sim311>3.0.co;2-q.