Graduate Program in Physical Therapy and Rehabilitation Science, University of Iowa, Iowa City, IA, USA.
Ergonomics. 2010 Jan;53(1):109-29. doi: 10.1080/00140130903389068.
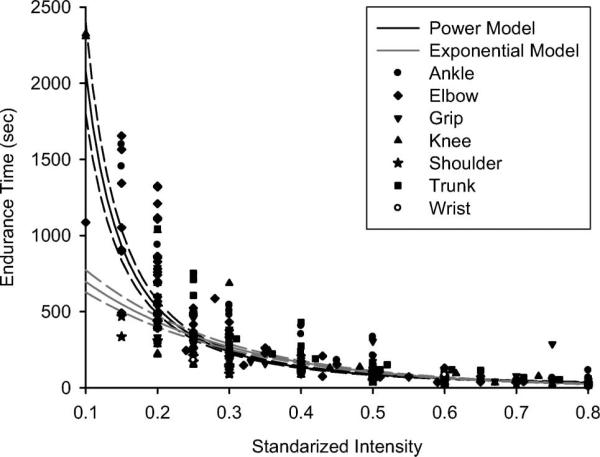
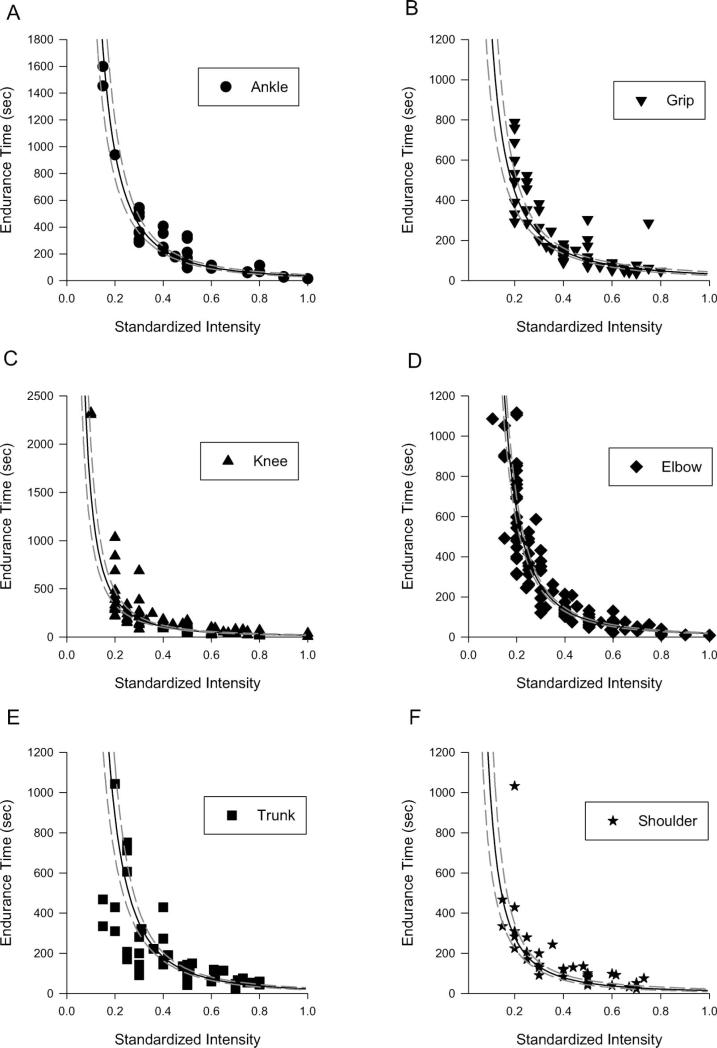
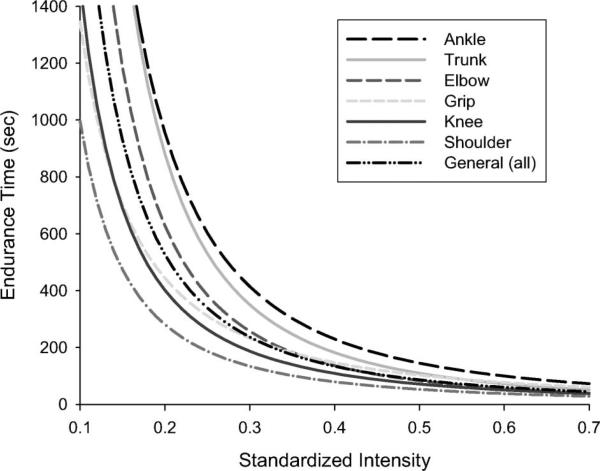
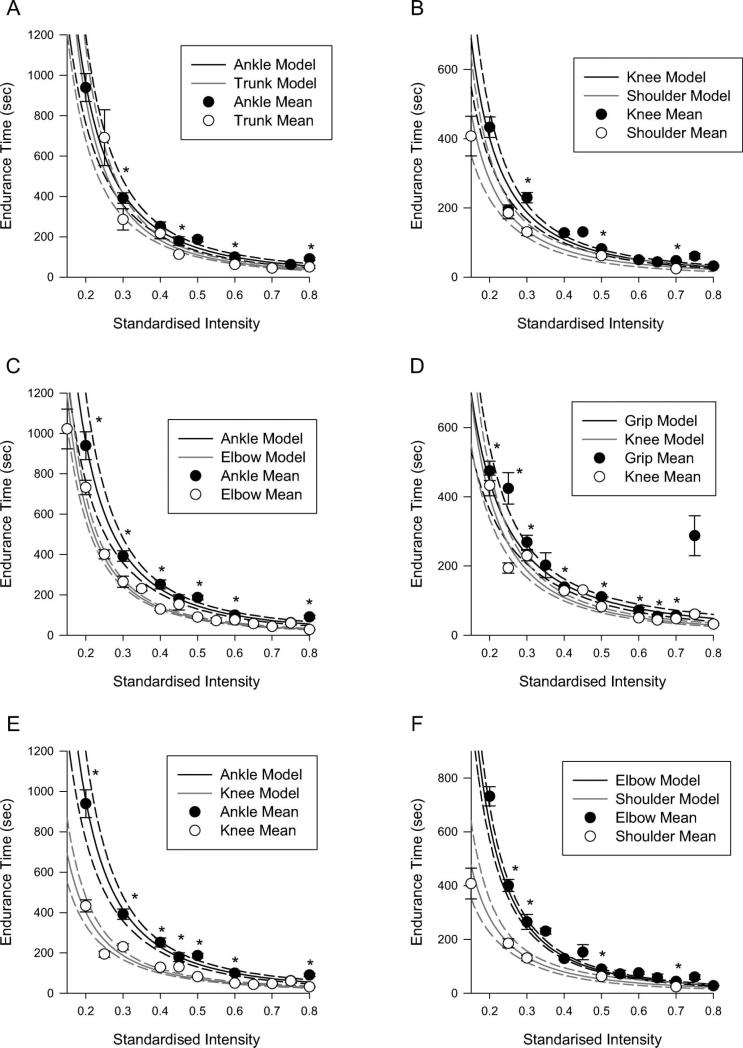
Static task intensity-endurance time (ET) relationships (e.g. Rohmert's curve) were first reported decades ago. However, a comprehensive meta-analysis to compare experimentally-observed ETs across bodily regions has not been reported. We performed a systematic literature review of ETs for static contractions, developed joint-specific power and exponential models of the intensity-ET relationships, and compared these models between each joint (ankle, trunk, hand/grip, elbow, knee, and shoulder) and the pooled data (generalised curve). 194 publications were found, representing a total of 369 data points. The power model provided the best fit to the experimental data. Significant intensity-dependent ET differences were predicted between each pair of joints. Overall, the ankle was most fatigue-resistant, followed by the trunk, hand/grip, elbow, knee and finally the shoulder was most fatigable. We conclude ET varies systematically between joints, in some cases with large effect sizes. Thus, a single generalised ET model does not adequately represent fatigue across joints. STATEMENT OF RELEVANCE: Rohmert curves have been used in ergonomic analyses of fatigue, as there are limited tools available to accurately predict force decrements. This study provides updated endurance time-intensity curves using a large meta-analysis of fatigue data. Specific models derived for five distinct joint regions should further increase prediction accuracy.
静态任务强度-耐力时间(ET)关系(例如 Rohmert 曲线)早在几十年前就有报道。然而,尚未有针对身体各部位进行的实验观察到的 ET 进行综合荟萃分析的报道。我们对静态收缩的 ET 进行了系统的文献回顾,开发了关节特异性的强度-ET 关系的幂和指数模型,并比较了每个关节(脚踝、躯干、手/握力、肘部、膝盖和肩部)和汇总数据(广义曲线)之间的这些模型。共发现 194 篇文献,代表了 369 个数据点。幂模型对实验数据的拟合度最好。预测各对关节之间存在显著的强度依赖性 ET 差异。总体而言,脚踝的抗疲劳能力最强,其次是躯干、手/握力、肘部、膝盖,最后是肩部最易疲劳。我们得出结论,ET 在关节之间系统地变化,在某些情况下具有较大的效应大小。因此,单个广义 ET 模型不能充分代表关节之间的疲劳。相关性陈述:Rohmert 曲线已用于疲劳的人体工程学分析,因为可用的工具有限,无法准确预测力的衰减。本研究使用疲劳数据的大型荟萃分析提供了更新的耐力时间-强度曲线。为五个不同关节区域推导的特定模型应进一步提高预测准确性。