Department of Otolaryngology-Head and Neck Surgery, Washington University School of Medicine, St. Louis, MO, USA.
Otolaryngol Head Neck Surg. 2010 Sep;143(3):331-6. doi: 10.1016/j.otohns.2010.05.007.
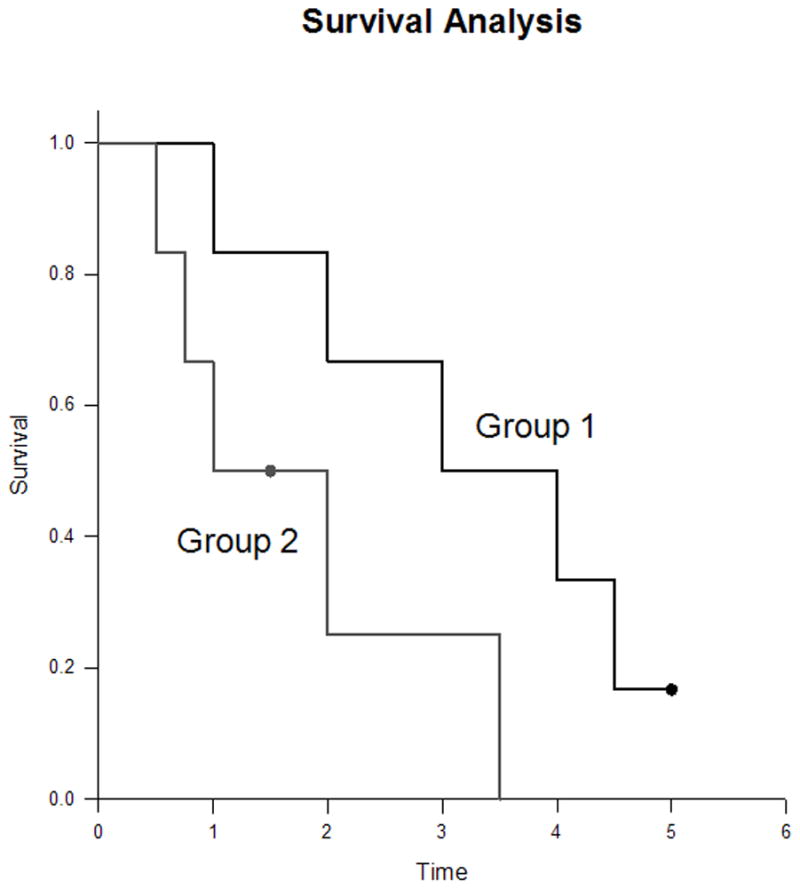
In 1958, Edward L. Kaplan and Paul Meier collaborated to publish a seminal paper on how to deal with incomplete observations. Subsequently, the Kaplan-Meier curves and estimates of survival data have become a familiar way of dealing with differing survival times (times-to-event), especially when not all the subjects continue in the study. "Survival" times need not relate to actual survival with death being the event; the "event" may be any event of interest. Kaplan-Meier analyses are also used in nonmedical disciplines. The purpose of this article is to explain how Kaplan-Meier curves are generated and analyzed. Throughout this article, we will discuss Kaplan-Meier estimates in the context of "survival" before the event of interest. Two small groups of hypothetical data are used as examples in order for the reader to clearly see how the process works. These examples also illustrate the crucially important point that comparative analysis depends upon the whole curve and not upon isolated points.
1958 年,爱德华·L·卡普兰(Edward L. Kaplan)和保罗·梅尔(Paul Meier)合作发表了一篇关于如何处理不完整观测的开创性论文。随后,Kaplan-Meier 曲线和生存数据的估计成为处理不同生存时间(事件时间)的常用方法,特别是当并非所有受试者都继续参与研究时。“生存”时间不一定与实际死亡相关,“事件”可以是任何感兴趣的事件。Kaplan-Meier 分析也用于非医学领域。本文的目的是解释 Kaplan-Meier 曲线的生成和分析方法。在本文中,我们将在感兴趣事件发生之前的“生存”背景下讨论 Kaplan-Meier 估计。为了使读者清楚地看到该过程的工作原理,我们使用了两个假设数据小组作为示例。这些示例还说明了一个至关重要的观点,即比较分析取决于整个曲线而不是孤立的点。