Department of Molecular Genetics, Donnelly Centre for Cellular and Biomolecular Research, University of Toronto, Toronto, Ontario, Canada.
PLoS One. 2010 Nov 15;5(11):e13984. doi: 10.1371/journal.pone.0013984.
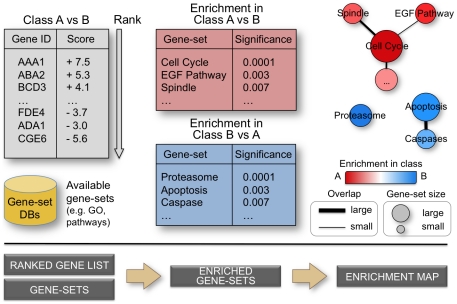
Gene-set enrichment analysis is a useful technique to help functionally characterize large gene lists, such as the results of gene expression experiments. This technique finds functionally coherent gene-sets, such as pathways, that are statistically over-represented in a given gene list. Ideally, the number of resulting sets is smaller than the number of genes in the list, thus simplifying interpretation. However, the increasing number and redundancy of gene-sets used by many current enrichment analysis software works against this ideal.
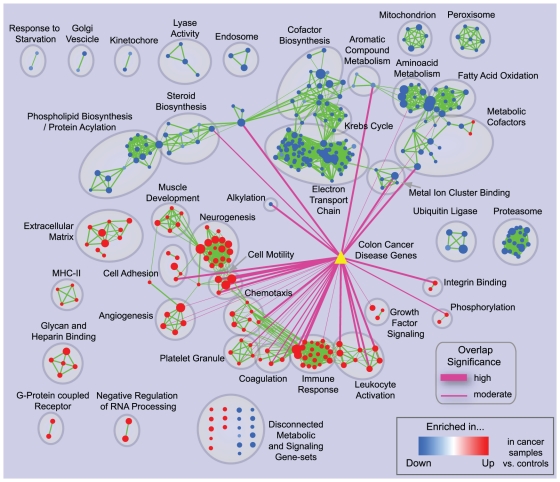
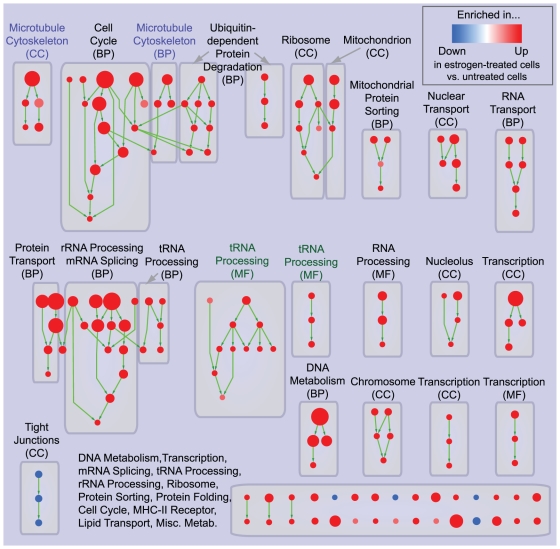
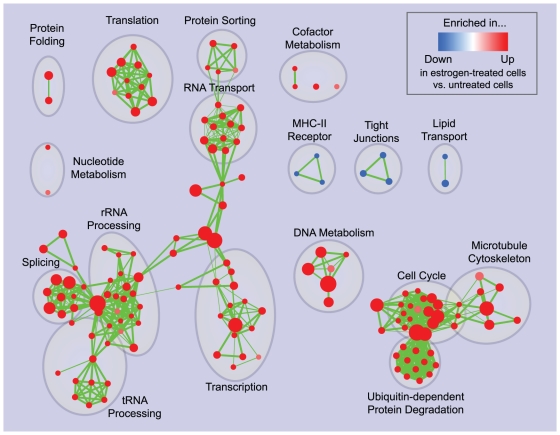
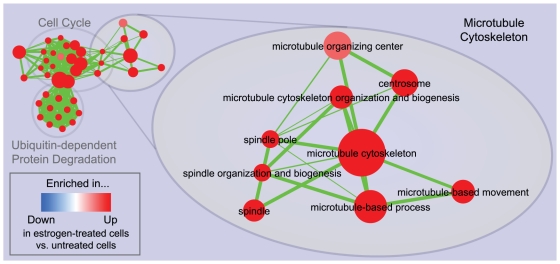
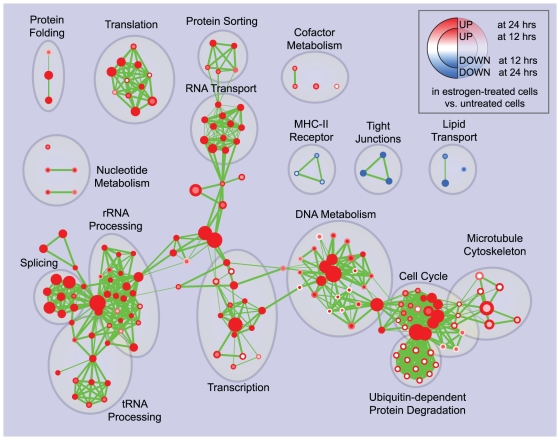
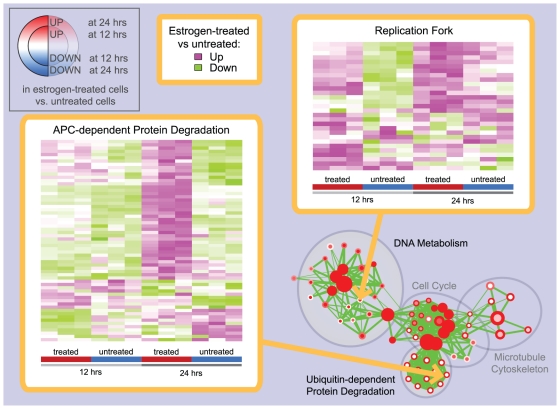
To overcome gene-set redundancy and help in the interpretation of large gene lists, we developed "Enrichment Map", a network-based visualization method for gene-set enrichment results. Gene-sets are organized in a network, where each set is a node and edges represent gene overlap between sets. Automated network layout groups related gene-sets into network clusters, enabling the user to quickly identify the major enriched functional themes and more easily interpret the enrichment results.
Enrichment Map is a significant advance in the interpretation of enrichment analysis. Any research project that generates a list of genes can take advantage of this visualization framework. Enrichment Map is implemented as a freely available and user friendly plug-in for the Cytoscape network visualization software (http://baderlab.org/Software/EnrichmentMap/).
基因集富集分析是一种有用的技术,可以帮助对大型基因列表(例如基因表达实验的结果)进行功能描述。该技术可找到功能一致的基因集,例如途径,这些基因在给定的基因列表中统计上过度表达。理想情况下,生成的集合数量应少于列表中的基因数量,从而简化解释。但是,许多当前的富集分析软件使用的基因集的数量和冗余性不断增加,这与理想情况背道而驰。
为了克服基因集的冗余性并帮助解释大型基因列表,我们开发了“富集图谱”,这是一种基于网络的基因集富集结果可视化方法。基因集在网络中进行组织,其中每个集都是一个节点,边缘表示集之间的基因重叠。自动网络布局将相关的基因集分组到网络簇中,使用户能够快速识别主要的富集功能主题,并更轻松地解释富集结果。
富集图谱是对富集分析进行解释的重大进展。任何生成基因列表的研究项目都可以利用此可视化框架。Enrichment Map 是 Cytoscape 网络可视化软件(http://baderlab.org/Software/EnrichmentMap/)的免费且用户友好的插件。