• 文献检索
  • 文档翻译
  • 深度研究
  • 学术资讯
  • Suppr Zotero 插件Zotero 插件
  • 邀请有礼
  • 套餐&价格
  • 历史记录
应用&插件
Suppr Zotero 插件Zotero 插件浏览器插件Mac 客户端Windows 客户端微信小程序
定价
高级版会员购买积分包购买API积分包
服务
文献检索文档翻译深度研究API 文档MCP 服务
关于我们
关于 Suppr公司介绍联系我们用户协议隐私条款
关注我们

Suppr 超能文献

核心技术专利:CN118964589B侵权必究
粤ICP备2023148730 号-1Suppr @ 2026

文献检索

告别复杂PubMed语法,用中文像聊天一样搜索,搜遍4000万医学文献。AI智能推荐,让科研检索更轻松。

立即免费搜索

文件翻译

保留排版,准确专业,支持PDF/Word/PPT等文件格式,支持 12+语言互译。

免费翻译文档

深度研究

AI帮你快速写综述,25分钟生成高质量综述,智能提取关键信息,辅助科研写作。

立即免费体验

量化基因列表在基于微阵列的临床生物标志物中的排序稳定性。

Quantifying stability in gene list ranking across microarray derived clinical biomarkers.

机构信息

Bayer AG, Bayer Technology Services, 51368 Leverkusen, Germany.

出版信息

BMC Med Genomics. 2011 Oct 14;4:73. doi: 10.1186/1755-8794-4-73.

DOI:10.1186/1755-8794-4-73
PMID:21996057
原文链接:https://pmc.ncbi.nlm.nih.gov/articles/PMC3206838/
Abstract

BACKGROUND

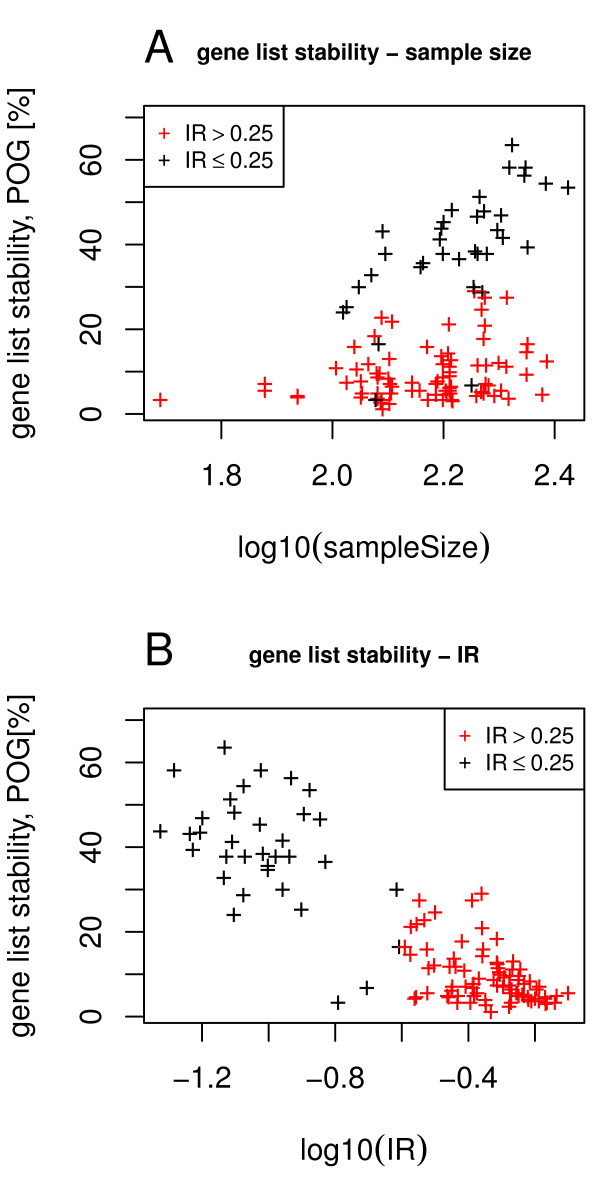
Identifying stable gene lists for diagnosis, prognosis prediction, and treatment guidance of tumors remains a major challenge in cancer research. Microarrays measuring differential gene expression are widely used and should be versatile predictors of disease and other phenotypic data. However, gene expression profile studies and predictive biomarkers are often of low power, requiring numerous samples for a sound statistic, or vary between studies. Given the inconsistency of results across similar studies, methods that identify robust biomarkers from microarray data are needed to relay true biological information. Here we present a method to demonstrate that gene list stability and predictive power depends not only on the size of studies, but also on the clinical phenotype.

RESULTS

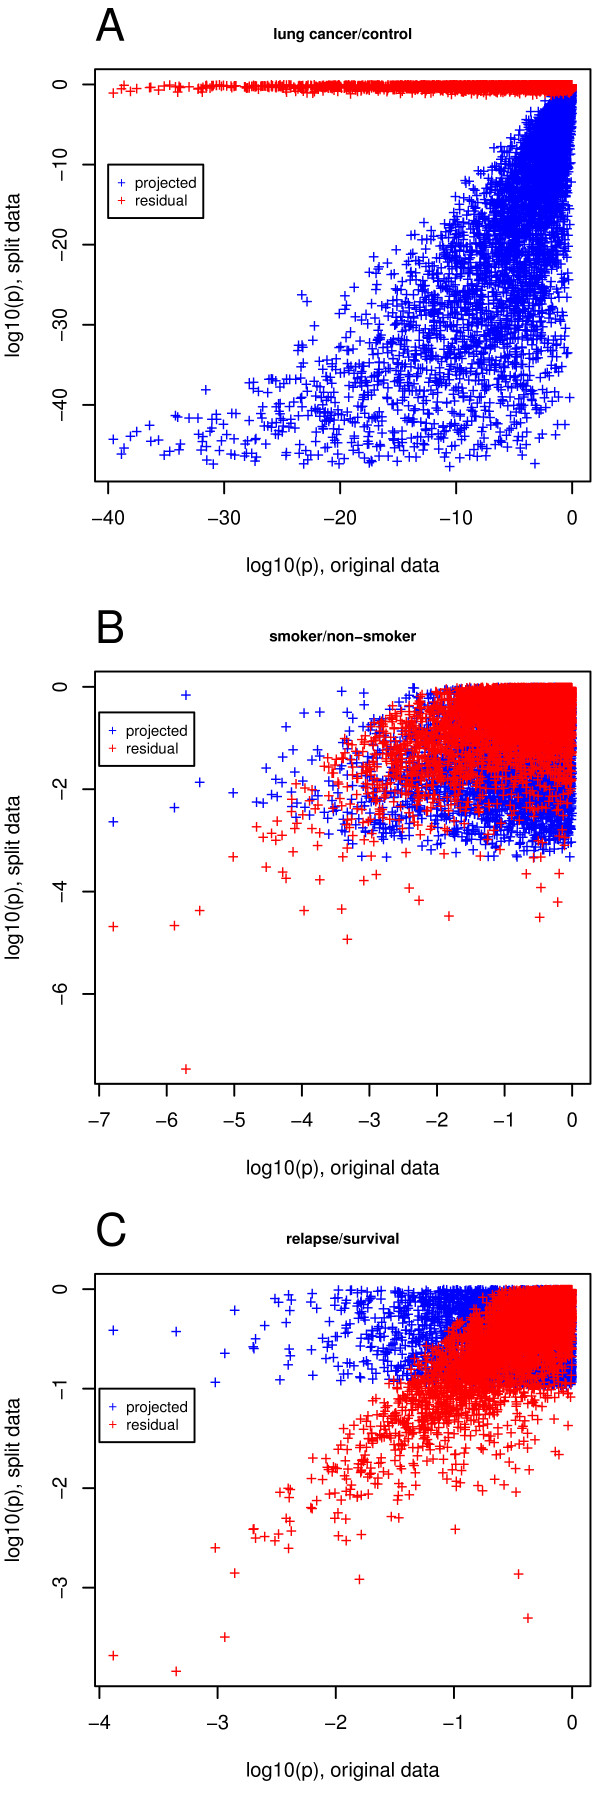
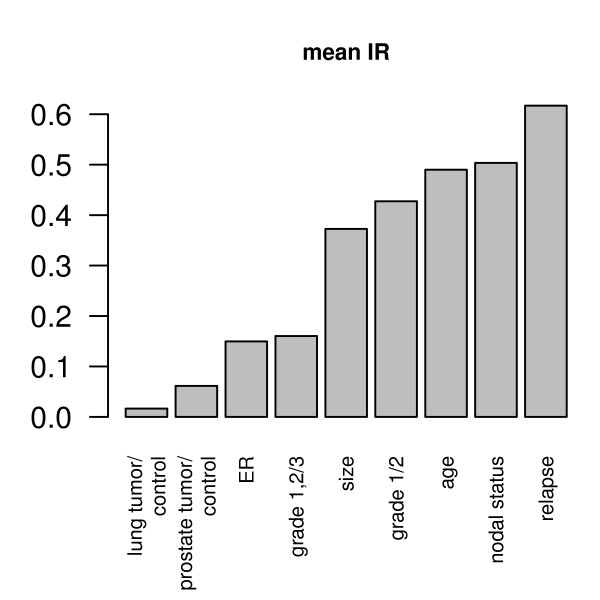
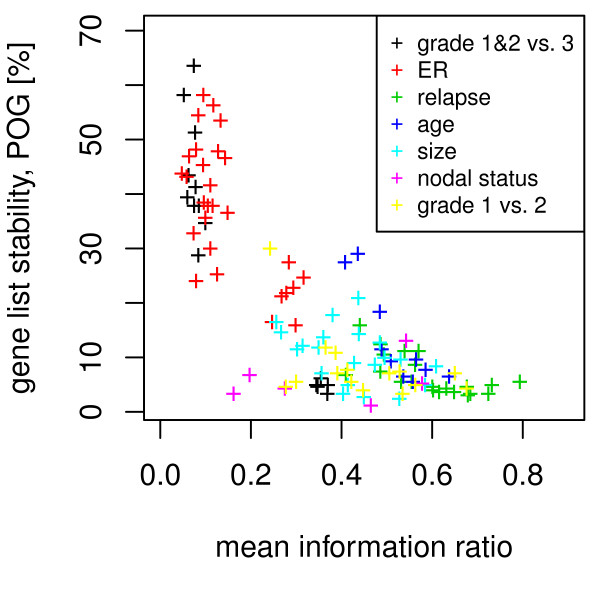
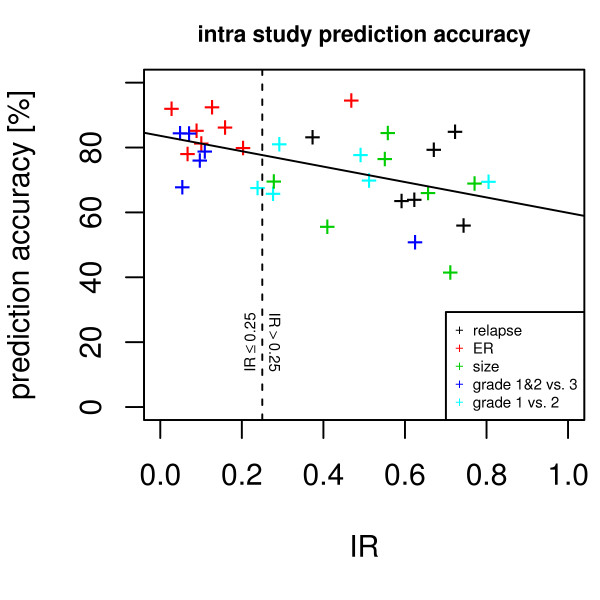
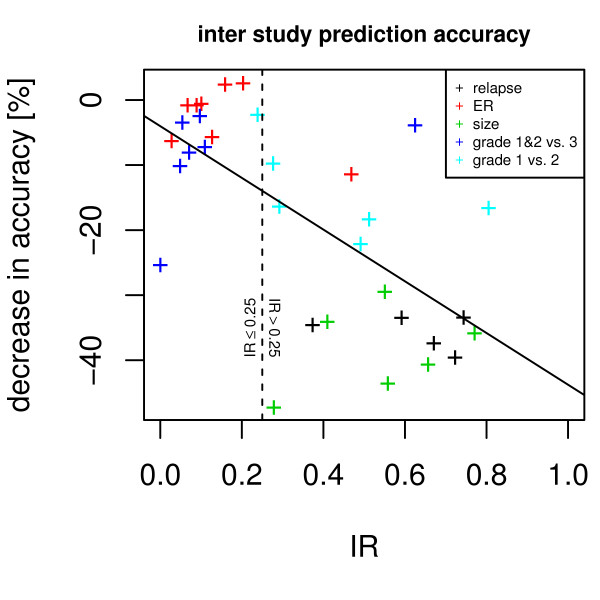
Our method projects genomic tumor expression data to a lower dimensional space representing the main variation in the data. Some information regarding the phenotype resides in this low dimensional space, while some information resides in the residuum. We then introduce an information ratio (IR) as a metric defined by the partition between projected and residual space. Upon grouping phenotypes such as tumor tissue, histological grades, relapse, or aging, we show that higher IR values correlated with phenotypes that yield less robust biomarkers whereas lower IR values showed higher transferability across studies. Our results indicate that the IR is correlated with predictive accuracy. When tested across different published datasets, the IR can identify information-rich data characterizing clinical phenotypes and stable biomarkers.

CONCLUSIONS

The IR presents a quantitative metric to estimate the information content of gene expression data with respect to particular phenotypes.

摘要

背景

鉴定用于肿瘤诊断、预后预测和治疗指导的稳定基因列表仍然是癌症研究中的一个主要挑战。测量差异基因表达的微阵列被广泛应用,并且应该是疾病和其他表型数据的多功能预测因子。然而,基因表达谱研究和预测生物标志物的功效往往较低,需要大量样本进行稳健的统计分析,或者在研究之间存在差异。鉴于类似研究的结果不一致,需要有从微阵列数据中识别稳健生物标志物的方法来传递真实的生物学信息。在这里,我们提出了一种方法来证明基因列表的稳定性和预测能力不仅取决于研究的规模,还取决于临床表型。

结果

我们的方法将基因组肿瘤表达数据投影到一个较低维度的空间中,代表数据的主要变化。一些关于表型的信息驻留在这个低维空间中,而一些信息驻留在残差中。然后,我们引入了一个信息比(IR)作为一个度量标准,由投影空间和残差空间之间的划分定义。在对肿瘤组织、组织学分级、复发或老化等表型进行分组后,我们表明,较高的 IR 值与产生不稳健生物标志物的表型相关,而较低的 IR 值则表现出较高的跨研究可转移性。我们的结果表明,IR 与预测准确性相关。当在不同的已发表数据集上进行测试时,IR 可以识别出以临床表型和稳定生物标志物为特征的富含信息的数据。

结论

IR 提供了一种定量度量标准,可以估计特定表型的基因表达数据的信息量。

https://cdn.ncbi.nlm.nih.gov/pmc/blobs/4a5b/3206838/a5898368a176/1755-8794-4-73-8.jpg
https://cdn.ncbi.nlm.nih.gov/pmc/blobs/4a5b/3206838/a3c635280e8b/1755-8794-4-73-1.jpg
https://cdn.ncbi.nlm.nih.gov/pmc/blobs/4a5b/3206838/f2c1af5c81e1/1755-8794-4-73-2.jpg
https://cdn.ncbi.nlm.nih.gov/pmc/blobs/4a5b/3206838/6f3cabe421ac/1755-8794-4-73-3.jpg
https://cdn.ncbi.nlm.nih.gov/pmc/blobs/4a5b/3206838/091b4fe3470b/1755-8794-4-73-4.jpg
https://cdn.ncbi.nlm.nih.gov/pmc/blobs/4a5b/3206838/7e8a2bfd9660/1755-8794-4-73-5.jpg
https://cdn.ncbi.nlm.nih.gov/pmc/blobs/4a5b/3206838/93823bedb0e0/1755-8794-4-73-6.jpg
https://cdn.ncbi.nlm.nih.gov/pmc/blobs/4a5b/3206838/b6b48fdc4664/1755-8794-4-73-7.jpg
https://cdn.ncbi.nlm.nih.gov/pmc/blobs/4a5b/3206838/a5898368a176/1755-8794-4-73-8.jpg

相似文献

1
Quantifying stability in gene list ranking across microarray derived clinical biomarkers.量化基因列表在基于微阵列的临床生物标志物中的排序稳定性。
BMC Med Genomics. 2011 Oct 14;4:73. doi: 10.1186/1755-8794-4-73.
2
Meta-analysis of breast cancer microarray studies in conjunction with conserved cis-elements suggest patterns for coordinate regulation.结合保守顺式元件对乳腺癌微阵列研究进行的荟萃分析揭示了协同调控模式。
BMC Bioinformatics. 2008 Jan 28;9:63. doi: 10.1186/1471-2105-9-63.
3
Sensitivity analysis of gene ranking methods in phenotype prediction.基因排序方法在表型预测中的敏感性分析。
J Biomed Inform. 2016 Dec;64:255-264. doi: 10.1016/j.jbi.2016.10.012. Epub 2016 Oct 26.
4
Integrating biological knowledge with gene expression profiles for survival prediction of cancer.整合生物学知识与基因表达谱以预测癌症患者的生存情况。
J Comput Biol. 2009 Feb;16(2):265-78. doi: 10.1089/cmb.2008.12TT.
5
Improving the efficiency of biomarker identification using biological knowledge.利用生物学知识提高生物标志物识别效率。
Pac Symp Biocomput. 2009:427-38.
6
A probabilistic approach for automated discovery of perturbed genes using expression data from microarray or RNA-Seq.一种使用来自微阵列或RNA测序的表达数据自动发现受干扰基因的概率方法。
Comput Biol Med. 2015 Dec 1;67:29-40. doi: 10.1016/j.compbiomed.2015.07.029. Epub 2015 Aug 14.
7
Diagnostic biomarkers for renal cell carcinoma: selection using novel bioinformatics systems for microarray data analysis.肾细胞癌的诊断生物标志物:使用新型生物信息学系统进行微阵列数据分析以进行选择。
Hum Pathol. 2009 Dec;40(12):1671-8. doi: 10.1016/j.humpath.2009.05.006. Epub 2009 Aug 19.
8
SplicerAV: a tool for mining microarray expression data for changes in RNA processing.剪接体分析工具(SplicerAV):一种挖掘微阵列表达数据中 RNA 处理变化的工具。
BMC Bioinformatics. 2010 Feb 25;11:108. doi: 10.1186/1471-2105-11-108.
9
Differential Coexpression Network Analysis for Gene Expression Data.基因表达数据的差异共表达网络分析
Methods Mol Biol. 2018;1754:155-165. doi: 10.1007/978-1-4939-7717-8_9.
10
Very Important Pool (VIP) genes--an application for microarray-based molecular signatures.非常重要的基因池(VIP)基因——基于微阵列的分子特征的一种应用。
BMC Bioinformatics. 2008 Aug 12;9 Suppl 9(Suppl 9):S9. doi: 10.1186/1471-2105-9-S9-S9.

引用本文的文献

1
Regulatory Network Inference of Induced Senescent Midbrain Cell Types Reveals Cell Type-Specific Senescence-Associated Transcriptional Regulators.诱导性衰老中脑细胞类型的调控网络推断揭示了细胞类型特异性衰老相关转录调节因子。
bioRxiv. 2025 Feb 6:2025.02.06.636893. doi: 10.1101/2025.02.06.636893.
2
Soft Modes as a Predictive Framework for Low Dimensional Biological Systems across Scales.软模作为跨尺度低维生物系统的预测框架
ArXiv. 2024 Dec 18:arXiv:2412.13637v1.
3
Data-driven human transcriptomic modules determined by independent component analysis.

本文引用的文献

1
The MicroArray Quality Control (MAQC)-II study of common practices for the development and validation of microarray-based predictive models.《基因芯片质量控制(MAQC)-II 研究:基于基因芯片的预测模型的开发和验证的常见实践》。
Nat Biotechnol. 2010 Aug;28(8):827-38. doi: 10.1038/nbt.1665. Epub 2010 Jul 30.
2
Dimension reduction for high-dimensional data.高维数据的降维
Methods Mol Biol. 2010;620:417-34. doi: 10.1007/978-1-60761-580-4_14.
3
A global map of human gene expression.一张人类基因表达的全球图谱。
基于独立成分分析的人类转录组模块的数据分析。
BMC Bioinformatics. 2018 Sep 17;19(1):327. doi: 10.1186/s12859-018-2338-4.
4
A novel gene-expression-signature-based model for prediction of response to Tripterysium glycosides tablet for rheumatoid arthritis patients.基于基因表达谱的新型模型预测雷公藤多苷片治疗类风湿关节炎患者的疗效。
J Transl Med. 2018 Jul 4;16(1):187. doi: 10.1186/s12967-018-1549-9.
5
Principal components analysis and the reported low intrinsic dimensionality of gene expression microarray data.主成分分析与基因表达微阵列数据所报道的低内在维度
Sci Rep. 2016 Jun 2;6:25696. doi: 10.1038/srep25696.
6
Combined Population Dynamics and Entropy Modelling Supports Patient Stratification in Chronic Myeloid Leukemia.结合种群动力学和熵建模支持慢性髓性白血病患者分层
Sci Rep. 2016 Apr 6;6:24057. doi: 10.1038/srep24057.
7
PhysioSpace: relating gene expression experiments from heterogeneous sources using shared physiological processes.PhysioSpace:利用共享的生理过程将来自异构源的基因表达实验联系起来。
PLoS One. 2013 Oct 17;8(10):e77627. doi: 10.1371/journal.pone.0077627. eCollection 2013.
8
Prediction errors in learning drug response from gene expression data - influence of labeling, sample size, and machine learning algorithm.从基因表达数据中学习药物反应的预测误差 - 标签、样本量和机器学习算法的影响。
PLoS One. 2013 Jul 23;8(7):e70294. doi: 10.1371/journal.pone.0070294. Print 2013.
Nat Biotechnol. 2010 Apr;28(4):322-4. doi: 10.1038/nbt0410-322.
4
The generalisation of student's problems when several different population variances are involved.当涉及几个不同总体方差时学生问题的推广。
Biometrika. 1947;34(1-2):28-35. doi: 10.1093/biomet/34.1-2.28.
5
Stability and aggregation of ranked gene lists.排名基因列表的稳定性和聚集性。
Brief Bioinform. 2009 Sep;10(5):556-68. doi: 10.1093/bib/bbp034.
6
Evaluating reproducibility of differential expression discoveries in microarray studies by considering correlated molecular changes.通过考虑相关分子变化评估微阵列研究中差异表达发现的可重复性。
Bioinformatics. 2009 Jul 1;25(13):1662-8. doi: 10.1093/bioinformatics/btp295. Epub 2009 May 5.
7
ArrayExpress update--from an archive of functional genomics experiments to the atlas of gene expression.ArrayExpress更新——从功能基因组学实验存档到基因表达图谱
Nucleic Acids Res. 2009 Jan;37(Database issue):D868-72. doi: 10.1093/nar/gkn889. Epub 2008 Nov 10.
8
The humoral immune system has a key prognostic impact in node-negative breast cancer.体液免疫系统在淋巴结阴性乳腺癌中具有关键的预后影响。
Cancer Res. 2008 Jul 1;68(13):5405-13. doi: 10.1158/0008-5472.CAN-07-5206.
9
[Gene expression profiling in cancer research].[癌症研究中的基因表达谱分析]
Bull Cancer. 2007 Nov;94(11):976-80.
10
A stromal gene signature associated with inflammatory breast cancer.一种与炎性乳腺癌相关的基质基因特征。
Int J Cancer. 2008 Mar 15;122(6):1324-32. doi: 10.1002/ijc.23237.